How Do You Actually Compare?
by Braden Kelley and Art Inteligencia
Most organizations benchmark their customer experience against themselves. They track NPS month over month, monitor CSAT scores quarter over quarter, and celebrate when the numbers move up. What they rarely do is answer the question that actually matters for competitive survival: how does our experience compare to what our customers can get elsewhere?
Customer experience benchmarking — the systematic comparison of your experience performance against competitors, industry standards, and best-in-class exemplars — is one of the most underused tools in the CX practitioner’s toolkit. It is also one of the most important. CX leaders generate 6x the revenue growth of bottom-quartile peers, per the Forrester CX Index 2026. The gap between leaders and laggards is widening, not narrowing. Organizations that don’t know where they stand relative to that gap are making investment decisions in the dark.
What is Customer Experience Benchmarking?
Customer experience benchmarking is the process of systematically measuring your organization’s experience performance against external reference points — competitors, industry standards, and best-in-class organizations — to understand where you lead, where you lag, and where investment will generate the greatest competitive return.
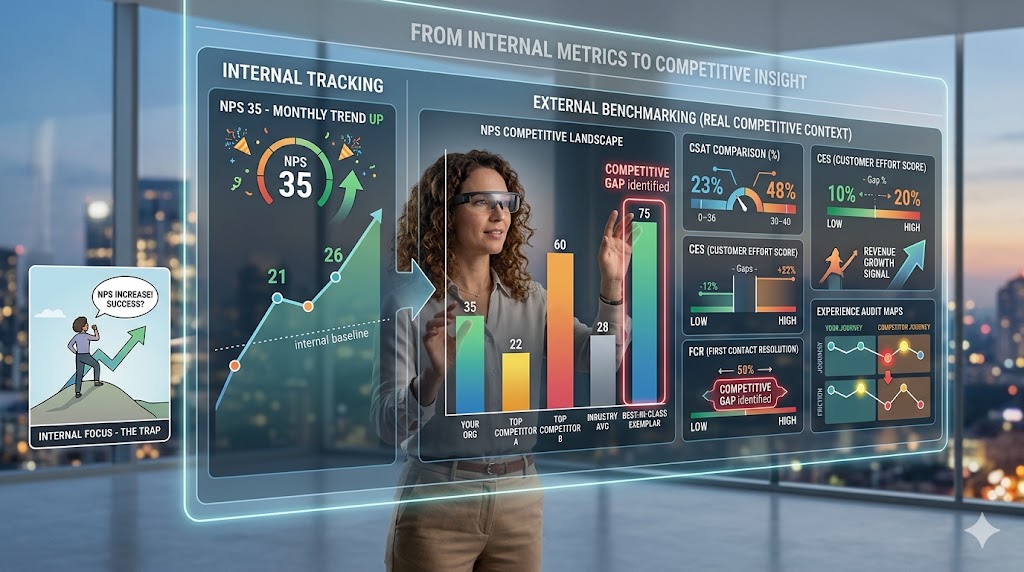
It is distinct from customer experience measurement, which tracks your own performance over time. Benchmarking adds the external context that transforms a metric from a number into a signal. A Net Promoter Score of 35 means nothing in isolation. A Net Promoter Score of 35 in an industry where the average is 22 means you are performing above average. A score of 35 in an industry where leaders are at 60 means you have a significant competitive gap to close.
Without benchmarking, organizations routinely invest in improving metrics that are already competitive while ignoring gaps that are costing them customers and revenue.
Why Most CX Benchmarking Falls Short
The most common form of CX benchmarking — comparing NPS, CSAT, and CES scores against published industry averages — is useful but severely limited. CSAT is typically based on how consumers feel about a service or product on a sliding scale, and CES measures how effortless it is for customers to interact with an organization. These are legitimate signals, but they have three critical limitations as benchmarking tools:
They measure what customers say, not what they experience. Survey-based metrics capture customer perceptions at a moment in time, filtered through whatever prompted them to respond. They systematically miss the silent majority — customers who had mediocre experiences but didn’t feel strongly enough to complete a survey — and they overrepresent the emotional extremes.
They measure aggregate outcomes, not specific experience drivers. Knowing your NPS is below industry average tells you that you have a problem. It doesn’t tell you where in the journey the problem lives, what is causing it, or what to fix. Benchmarking aggregate scores without diagnosing the specific experience gaps producing them leads to unfocused investment that improves the score without improving the underlying experience.
They don’t capture the full competitive experience landscape. Published industry benchmarks aggregate across organizations with very different models, customer bases, and experience investments. Your real competitive benchmark is not the industry average — it is the specific alternatives your customers are comparing you to, evaluated on the specific dimensions they care about most.
The Four Levels of Customer Experience Benchmarking
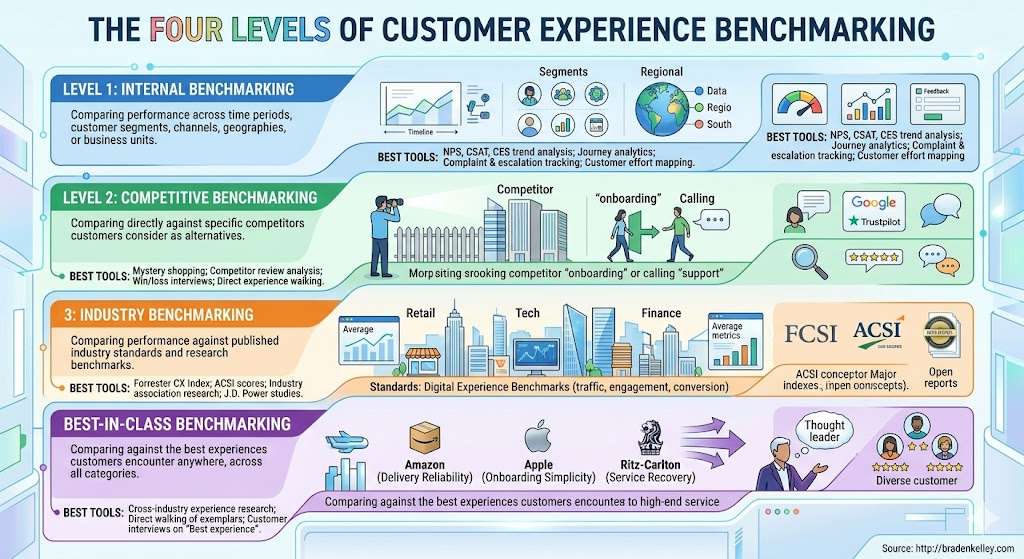
Effective customer experience benchmarking operates at four levels, each providing different and complementary insight:
Level 1: Internal Benchmarking
Comparing your own experience performance across time periods, customer segments, channels, geographies, or business units. Internal benchmarking establishes your baseline, identifies where performance is improving or declining, and surfaces the internal variations that indicate what better is possible — if your highest-performing region or channel is significantly outperforming others, the gap represents an internal benchmark that can be studied and replicated.
Best tools: NPS, CSAT, CES trend analysis; journey analytics; complaint and escalation rate tracking; customer effort mapping across channels.
Level 2: Competitive Benchmarking
Comparing your experience performance directly against the specific competitors your customers are most likely to consider as alternatives. This is the most commercially important form of benchmarking and the most underinvested. Analyzing competitor reviews on platforms like Google and Trustpilot and looking for patterns in customer feedback — recurring praise or common complaints — is a starting point. But the most valuable competitive benchmarking requires actually walking the competitor’s experience firsthand — going through their onboarding, calling their support line, submitting a service request — to understand the experience your customers are comparing you to.
Best tools: Mystery shopping of competitors; competitor review analysis; win/loss interview research; shared customer feedback analysis; direct experience walking.
Level 3: Industry Benchmarking
Comparing your performance against published industry standards and research benchmarks. Tools like Contentsquare’s 2026 Digital Experience Benchmark, built from 99 billion web sessions across 6,500+ websites in 9 industries, provide cross-device behavior data spanning traffic, engagement, frustration, conversion, and retention. Forrester’s CX Index, the ACSI (American Customer Satisfaction Index), and industry-specific research provide standardized benchmarks across NPS, CSAT, and CES by sector.
Best tools: Forrester CX Index; ACSI scores by industry; Contentsquare Digital Experience Benchmark; J.D. Power studies; industry association research.
Level 4: Best-in-Class Benchmarking
Comparing your experience against the best experiences your customers encounter anywhere — not just in your industry, but across the categories they interact with most frequently. This is the most ambitious and most valuable form of benchmarking, because customers don’t evaluate your experience against your direct competitors alone. They evaluate it against every excellent experience they have — Amazon’s delivery reliability, Apple’s onboarding simplicity, Ritz-Carlton’s service recovery. When an experience falls below the best available standard in any category, it registers as inadequate regardless of industry norms.
Best tools: Cross-industry experience research; direct walking of best-in-class exemplars; customer interviews that explicitly ask “what’s the best experience you’ve had with any company in any category, and what made it great?”
Key Customer Experience Benchmarks by Metric
Net Promoter Score (NPS) Benchmarks
NPS ranges from -100 to +100. General interpretation: above 0 is good, above 20 is favorable, above 50 is excellent, above 70 is world-class. Industry averages vary significantly:
- Technology/SaaS: 35–45 average; leaders 60+
- Financial Services: 30–40 average; leaders 55+
- Retail: 40–50 average; leaders 65+
- Healthcare: 25–35 average; leaders 50+
- Telecommunications: 15–25 average; leaders 40+
- Hospitality: 50–60 average; leaders 75+
Customer Satisfaction Score (CSAT) Benchmarks
CSAT is typically measured on a 1–5 or 1–10 scale and converted to a percentage of satisfied respondents. Industry averages cluster around 75–85% across most sectors, with leaders consistently achieving 90%+. ACSI data for 2025–2026 shows overall US customer satisfaction at approximately 77.4 out of 100 across industries.
Customer Effort Score (CES) Benchmarks
CES measures how easy it is for customers to interact with your organization, typically on a 1–7 scale. Lower effort scores are better. Research by CEB (now Gartner) found that reducing customer effort is more predictive of loyalty than delighting customers — 96% of customers with high-effort experiences become more disloyal, versus only 9% of those with low-effort experiences.
First Contact Resolution (FCR) Benchmarks
FCR measures the percentage of customer issues resolved on first contact. Industry average FCR rates cluster around 70–75%, with best-in-class operations achieving 85–90%. Every percentage point improvement in FCR drives measurable improvements in both CSAT and cost-to-serve.
How to Conduct a Customer Experience Benchmark
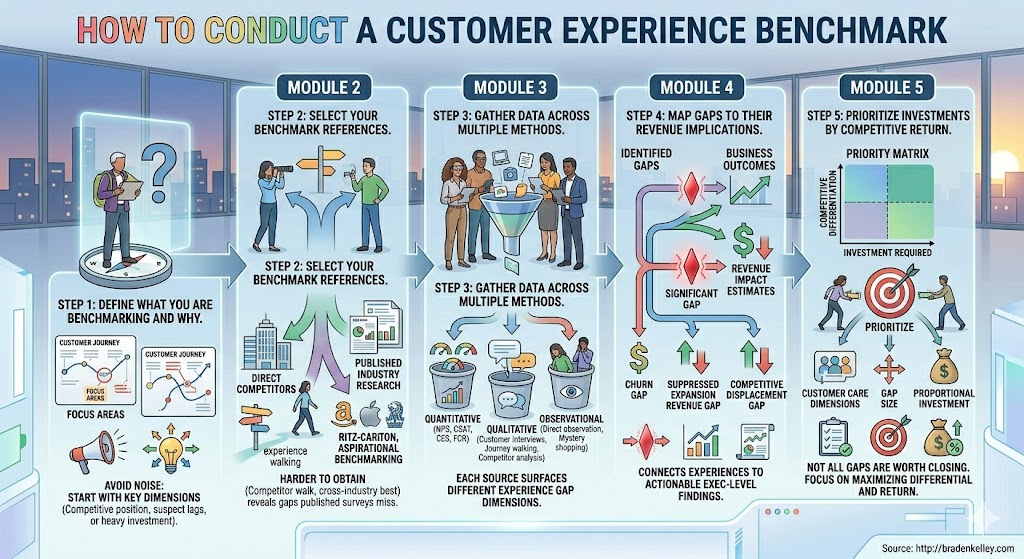
Step 1: Define what you are benchmarking and why
Benchmarking everything produces noise. Start with the specific experience dimensions most likely to be affecting your competitive position — the areas where you suspect you may be lagging, or where you are investing most heavily and want to validate that your performance justifies the investment.
Step 2: Select your benchmark references
For each dimension, identify the most relevant reference points: your direct competitors for competitive benchmarking, published industry research for industry benchmarking, and best-in-class exemplars for aspirational benchmarking. The most valuable benchmarks are often the ones that are hardest to obtain — direct competitor experience walking and cross-industry best-in-class research — precisely because they reveal gaps that published survey data doesn’t surface.
Step 3: Gather data across multiple methods
No single data source provides complete benchmark insight. Effective benchmarking combines quantitative measures (NPS, CSAT, CES, FCR) with qualitative research (customer interviews, journey walking, competitor experience analysis) and observational data (direct observation of experience delivery, mystery shopping). Each source surfaces different dimensions of the experience gap.
Step 4: Map gaps to their revenue implications
A benchmark gap is only useful if it is connected to a business outcome. For each significant gap identified, estimate the revenue implication: how much churn is this gap contributing to? How much expansion revenue is it suppressing? How much competitive displacement is it enabling? This translation from experience gap to revenue impact is what makes benchmarking findings actionable at the executive level.
Step 5: Prioritize investments by competitive return
Not all gaps are worth closing. Prioritize experience investments that address gaps in dimensions your customers care most about, where closing the gap would produce the largest competitive differentiation, and where the investment required is proportionate to the revenue at stake.
The Role of an Experience Audit in Benchmarking
A customer experience audit is the most comprehensive benchmarking instrument available — one that combines internal experience measurement, competitive experience walking, and best-in-class gap analysis into a single, systematic assessment.
Unlike survey-based benchmarking that measures what customers say about their experience, an experience audit walks the actual experience — physically and digitally traversing every significant touchpoint across your customer journey and your competitors’ — to produce a firsthand, evidence-based comparison (customer journey mapping helps here). It identifies:
- The specific touchpoints where your experience is measurably inferior to the best available alternatives
- The friction gaps — moments where your experience requires more effort than competitors’ equivalents
- The consistency gaps — channels or segments where your experience significantly underperforms your own average
- The service recovery gaps — how your response to failures compares to competitive and best-in-class standards
- The personalization gaps — where competitors are demonstrating deeper customer understanding than you are
The output is not a score comparison — it is a prioritized, actionable roadmap of experience improvements ranked by their estimated competitive and financial impact. This is benchmarking that produces decisions, not just data.
Frequently Asked Questions About Customer Experience Benchmarking
What is customer experience benchmarking?
Customer experience benchmarking is the process of systematically measuring your organization’s experience performance against external reference points — competitors, industry standards, and best-in-class organizations — to understand where you lead, where you lag, and where investment will generate the greatest competitive return. It differs from customer experience measurement, which tracks your own performance over time, by adding the external context needed to interpret whether your metrics represent a competitive advantage, a competitive parity position, or a competitive gap that requires urgent attention.
What metrics are used for customer experience benchmarking?
The primary metrics used for customer experience benchmarking are Net Promoter Score (NPS), Customer Satisfaction Score (CSAT), Customer Effort Score (CES), and First Contact Resolution (FCR). Published industry benchmarks for these metrics are available from Forrester, the ACSI, J.D. Power, and industry-specific research sources. However, survey-based metric benchmarking has significant limitations — it measures what customers say, not what they experience, and it measures aggregate outcomes rather than the specific experience drivers producing those outcomes. The most valuable benchmarking combines metric comparison with direct competitive experience walking and qualitative customer research.
How do you benchmark against competitors on customer experience?
Competitive customer experience benchmarking requires multiple approaches used in combination. Quantitative approaches include comparing published NPS, CSAT, and review scores across competitors; analyzing competitor reviews on platforms like Google, Trustpilot, and G2 for recurring patterns; and using win/loss interview research to understand the experience factors most frequently cited in competitive displacement. Qualitative approaches include directly walking the competitor’s experience — going through their onboarding, calling their support line, submitting a service request — to build firsthand understanding of the experience your customers are comparing you against. A customer experience audit typically includes direct competitive benchmarking as a core component.
What is a good NPS score by industry?
NPS benchmarks vary significantly by industry. In technology and SaaS, average NPS is typically 35–45 with leaders above 60. In financial services, averages run 30–40 with leaders above 55. Retail averages 40–50 with leaders above 65. Healthcare averages 25–35 with leaders above 50. Telecommunications typically averages 15–25 with leaders above 40. Hospitality averages 50–60 with leaders above 75. The most meaningful benchmark is not the industry average but the performance of the specific competitors your customers are most likely to compare you against — and the gap between your current performance and best-in-class in your sector.
What is the difference between customer experience measurement and benchmarking?
Customer experience measurement tracks your own performance over time — monitoring NPS, CSAT, CES, and other metrics to identify trends and evaluate the impact of specific investments. Customer experience benchmarking adds external context by comparing your performance against competitors, industry standards, and best-in-class organizations. Measurement tells you whether you are getting better or worse. Benchmarking tells you whether you are competitive — whether your current performance represents an advantage, parity, or a gap that is costing you customers and revenue. Both are necessary, but benchmarking is what connects experience performance to competitive and financial outcomes.
Ready to understand how your experience compares to competitors and best-in-class standards? Learn more about the Experience Audit →
Content Authenticity Statement: The topic area, key elements to focus on, etc. were decisions made by Braden Kelley, with a little help from Claude and Google Gemini to clean up the article, add images and create infographics.
Image credits: Google Gemini
![]() Sign up here to get Human-Centered Change & Innovation Weekly delivered to your inbox every week.
Sign up here to get Human-Centered Change & Innovation Weekly delivered to your inbox every week.


 Drum roll please…


 Today we will explore this question, along with its various aspects with our special guest