A System Designed to Concentrate Power – or Accelerate Breakthroughs?
LAST UPDATED: March 27, 2026 at 4:55 PM
by Braden Kelley and Art Inteligencia
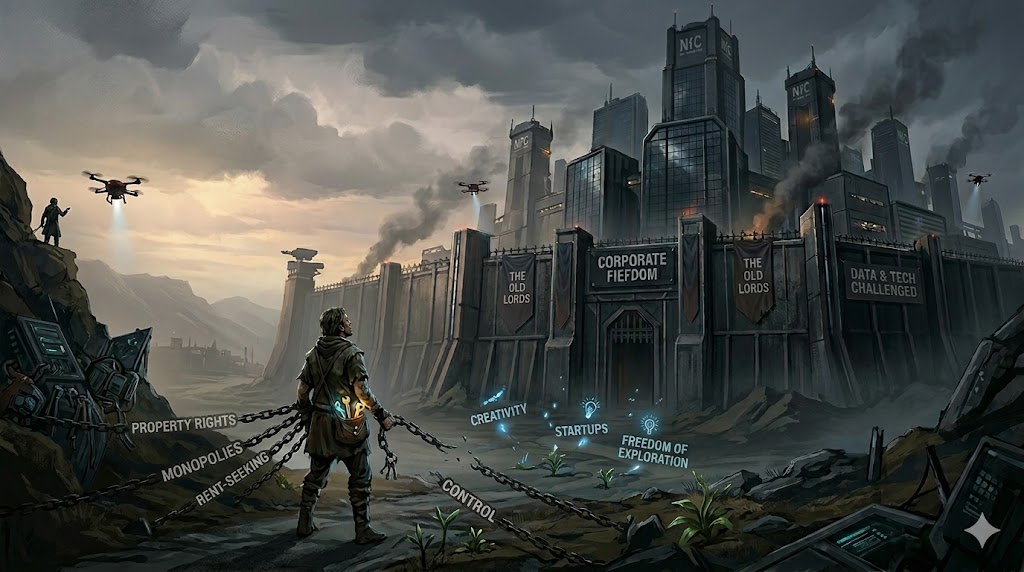
The Return of Lords and Serfs — But This Time It’s Digital
For decades, we’ve told ourselves a reassuring story about progress. Markets would open. Technology would democratize opportunity. Innovation would decentralize power. The barriers to entry would fall, and with them, the dominance of entrenched elites.
And yet, as we step back and observe the system we’ve actually built, a different pattern begins to emerge. Power is concentrating, not dispersing. A small number of platforms, institutions, and individuals exert outsized influence over how value is created, distributed, and captured. Access — whether to customers, capital, data, or opportunity — is increasingly mediated by gatekeepers.
We may not call them lords. We may not call ourselves serfs. But the structural similarities are becoming difficult to ignore.
This is the uncomfortable premise at the heart of the growing conversation around neo-feudalism: that despite the language of free markets and open innovation, we are drifting toward a system defined less by competition and more by control — less by ownership and more by dependency.
At the same time, we are living through one of the most explosive periods of innovation in human history. Artificial intelligence, biotechnology, climate tech, and digital platforms are reshaping industries at a pace that would have been unimaginable even a generation ago. The capacity to innovate has never been greater.
How can we be experiencing both unprecedented innovation and unprecedented concentration of power at the same time?
Is this concentration a temporary distortion — something the system will eventually correct? Or is it an emergent feature of how innovation now scales in a digital, platform-driven world?
What does this mean for the future of innovation itself?
Because innovation is never neutral. It does not exist in a vacuum. It is shaped — constrained or accelerated — by the systems in which it operates. If those systems are evolving toward something that resembles a modern form of feudalism, then the implications extend far beyond markets and technology. They touch how we work, how we live, how we build wealth, and how we relate to one another.
Before we can assess whether neo-feudalism is helping or hindering innovation, we must first understand what it actually is — and what it is not.
What Is Neo-Feudalism? A Clear, Modern Definition
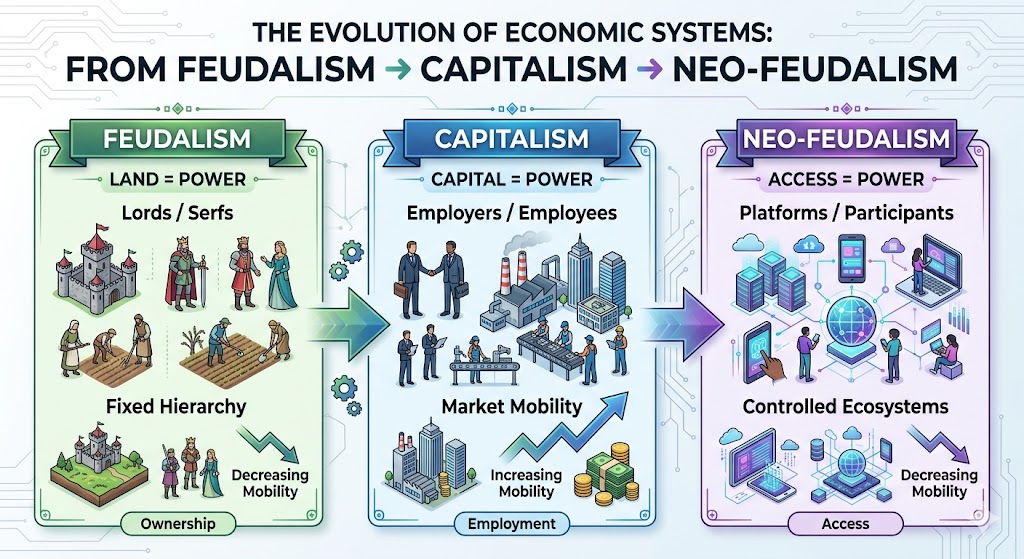
Neo-feudalism is a term increasingly used to describe a modern socio-economic system that echoes the structural dynamics of medieval feudalism, but in a contemporary, often digital, context. While not a perfect one-to-one comparison, the analogy is powerful because it highlights a shift away from open, competitive markets toward systems defined by concentrated power, controlled access, and growing dependency relationships.
At its core, neo-feudalism describes a world in which a relatively small number of dominant entities — whether corporations, platforms, or institutions — exercise outsized influence over how value is created and distributed. Individuals and smaller organizations, in turn, become increasingly dependent on these entities for access to customers, income, infrastructure, and opportunity.
Several key characteristics define this emerging pattern:
Concentration of Power: Economic and technological power is increasingly concentrated in the hands of a few dominant players, creating asymmetries that are difficult for others to overcome.
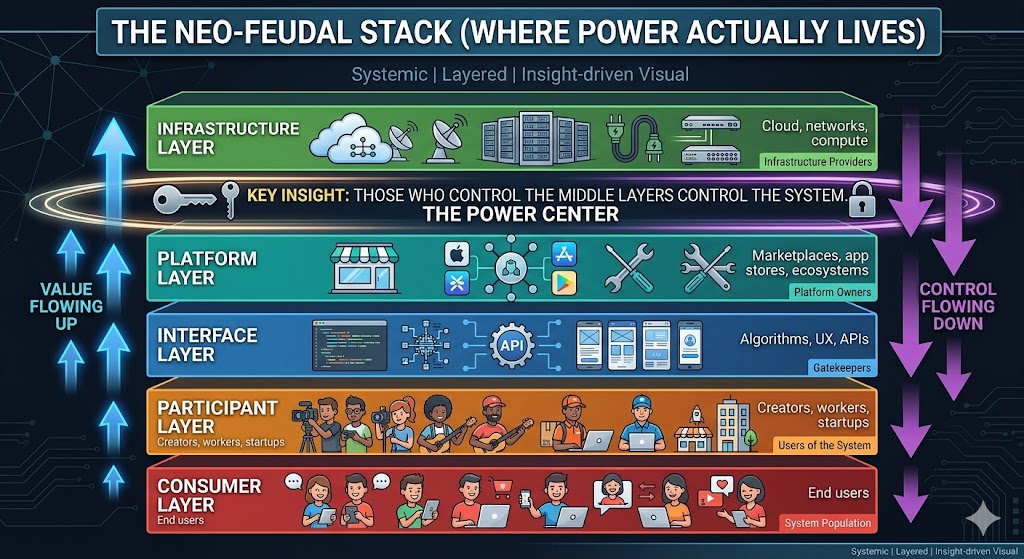
Control of Access: Instead of owning “land” in the traditional sense, modern power centers control platforms, ecosystems, and infrastructure — effectively determining who gets access to markets and audiences.
Reduced Mobility: Upward mobility becomes more constrained as success is tied to proximity to, or permission from, these dominant entities.
Dependency Relationships: Workers, creators, and even companies become reliant on platforms and systems they do not control, trading autonomy for access and stability.
This dynamic shows up clearly in today’s economy. Digital platforms function as gatekeepers to visibility and revenue. The gig economy often shifts risk downward while concentrating rewards upward. Ownership — whether of assets, data, or distribution channels — is increasingly replaced by access-based models.
It is important to note that neo-feudalism is not a universally accepted or precisely defined concept. Variations of the idea have emerged to describe different aspects of the same shift.
Techno-feudalism emphasizes the role of large technology platforms in exerting control over digital markets and behaviors. Corporate neo-feudalism highlights the growing influence of multinational corporations as quasi-governing entities. Neo-medievalism points to a broader fragmentation of authority, where power is distributed across states, corporations, and networks rather than centralized in traditional nation-states.
Whether one views neo-feudalism as a precise diagnosis or simply a provocative metaphor, it serves an important purpose: it forces us to examine how power, access, and opportunity are actually structured in the modern economy — not how we assume they function.
And that distinction matters, because the way we define the system ultimately shapes how we understand its impact on innovation.
What Thought Leaders Are Saying (Pro and Con)
As the idea of neo-feudalism has gained traction, it has sparked a vigorous debate among economists, technologists, and social theorists. Some argue that we are witnessing a fundamental shift in the structure of the economy. Others contend that the term is more metaphor than reality. Understanding this debate is essential, because how we interpret the system shapes how we respond to it.
The “Yes, This Is Neo-Feudalism” Camp
Proponents of the concept argue that capitalism has evolved into something meaningfully different. In their view, markets are no longer truly open. Instead, they are increasingly controlled by dominant platforms that act as gatekeepers, setting the rules of participation and extracting value from those who depend on them.
This perspective suggests that we are moving toward a system where economic power resembles sovereignty. A small number of organizations exert control not just over markets, but over infrastructure, data flows, and even the terms of social interaction. In this view, individuals and businesses operate less as independent actors and more as participants within controlled ecosystems.
Some thought leaders have gone so far as to label this shift “techno-feudalism,” arguing that the owners of digital platforms function much like modern-day lords — owning the “land” on which economic activity takes place and collecting rents from those who operate within it.
The “No, This Is Still Capitalism” Camp
Critics of the neo-feudalism framing argue that while inequality and concentration have increased, the underlying system remains capitalism. Markets still exist, competition still occurs, and individuals are not bound to specific employers or platforms in the way serfs were bound to land.
From this perspective, the term “neo-feudalism” risks overstating the case and obscuring more practical diagnoses such as monopoly power, regulatory failure, or the natural dynamics of late-stage capitalism. These critics argue that using an imprecise metaphor may make the problem feel more dramatic, but less actionable.
They also point out that technological disruption continues to create new entrants and new forms of competition, even in industries that appear highly concentrated.
The Middle Ground: A Useful Lens, Not a Literal System
Between these two poles lies a more nuanced view. In this framing, neo-feudalism is not a literal description of the current system, but a lens that helps illuminate important structural shifts—particularly around power, access, and dependency.
This perspective acknowledges that while we are not returning to medieval conditions, we are seeing the emergence of dynamics that echo them in meaningful ways. The language of neo-feudalism, therefore, becomes a way to surface risks that might otherwise remain hidden behind the more familiar vocabulary of markets and competition.
Ultimately, the debate itself is revealing. The lack of consensus reflects the reality that we are in a transitional moment. The system is evolving faster than our ability to define it, and the labels we use are struggling to keep up.
But regardless of what we call it, the underlying question remains the same: how do these structural shifts influence the way innovation is created, scaled, and distributed?
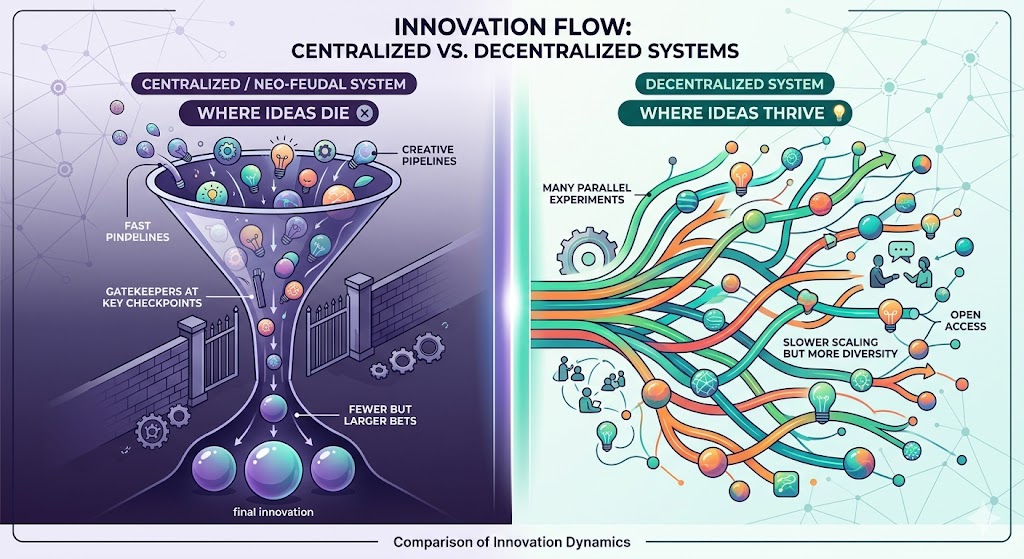
The Case FOR Neo-Feudalism as a Positive Force for Innovation
At first glance, the idea that neo-feudalism could have a positive impact on innovation feels counterintuitive. After all, concentration of power and dependency relationships seem fundamentally at odds with the open, exploratory nature of innovation. But history — and the present moment — suggest a more complicated reality.
Under certain conditions, the very structures that concentrate power can also accelerate innovation in ways that more distributed systems struggle to match.
Stability Enables Long-Term Investment
One of the defining advantages of concentrated power is the ability to think and act long term. Large, dominant organizations have the resources and stability to invest in high-risk, high-reward initiatives that smaller players simply cannot afford. From artificial intelligence to space exploration to advanced biotechnology, many of today’s most ambitious innovations are being funded and scaled by entities with near-sovereign levels of capital and control.
Platforms as Innovation Ecosystems
Modern platforms function as structured environments where innovation can occur rapidly. By providing standardized tools, infrastructure, and access to large user bases, they reduce friction for developers, entrepreneurs, and creators. In this sense, innovation happens “inside the castle walls,” where the rules are clear, the tools are accessible, and the pathways to scale are well established.
Talent Aggregation and Network Effects
Concentrated systems tend to attract concentrated talent. The best engineers, designers, and thinkers often cluster around leading organizations and ecosystems, creating dense networks of expertise. These environments increase the likelihood of idea collisions, accelerate learning cycles, and amplify the pace of innovation.
Reduced Coordination Costs
In highly decentralized systems, innovation can stall due to fragmentation, misalignment, and slow decision-making. Centralized structures, by contrast, can move quickly. Decisions are made faster, resources are allocated more efficiently, and large-scale initiatives can be executed without the same level of negotiation or compromise.
This speed can be a decisive advantage in domains where timing matters, from technology development to market entry.
The Rise of Patronage 2.0
In many ways, today’s innovation economy mirrors a modern form of patronage. Venture capital firms, large platforms, and corporate innovation arms provide funding, infrastructure, and distribution in exchange for equity, data, or dependence. While this relationship is not without tradeoffs, it enables individuals and startups to pursue ideas that might otherwise never get off the ground.
For many innovators, aligning with a powerful “patron” is the fastest — and sometimes only — path to scale.
Seen through this lens, neo-feudal dynamics do not simply constrain innovation. They can also create the conditions for rapid advancement, particularly at the frontier of technology.
The question, then, is not whether these structures can produce innovation. Clearly, they can. The more important question is what kinds of innovation they produce — and who ultimately benefits from them.
The Case AGAINST Neo-Feudalism as a Constraint on Innovation
While concentrated power can accelerate certain kinds of innovation, it can just as easily suppress others. From a human-centered perspective, neo-feudal dynamics introduce structural constraints that limit who gets to innovate, what gets built, and how value is ultimately distributed.
In many cases, the same forces that enable scale at the top create friction, dependency, and invisibility at the edges.
Innovation Becomes Permission-Based
In a neo-feudal system, access is controlled. Platforms, investors, and dominant institutions act as gatekeepers, determining which ideas receive funding, visibility, and distribution. This shifts innovation from an open exploration to a permission-based system, where success depends as much on alignment with gatekeepers as it does on the quality of the idea itself.
The risk is clear: truly disruptive ideas — especially those that threaten existing power structures — may never see the light of day.
Decreased Diversity of Thought
When influence is concentrated within a relatively small group, so too are perspectives. Innovation thrives on diverse viewpoints, lived experiences, and unconventional thinking. But tightly connected elite networks can become echo chambers, reinforcing shared assumptions and filtering out ideas that fall outside the dominant narrative.
The result is a narrowing of the innovation pipeline at precisely the moment when broader input is most needed.
Talent Trapped in Dependency Loops
For many workers, creators, and entrepreneurs, participation in the modern economy requires dependence on platforms they do not control. Income, visibility, and growth are tied to algorithms, policies, and business models that can change without warning.
This uncertainty discourages risk-taking. When livelihoods are fragile, people optimize for stability rather than exploration — reducing the willingness to pursue bold or unconventional ideas.
Extraction Over Creation
As platforms mature, their incentives often shift from enabling value creation to maximizing value capture. Business models become optimized for rent extraction — taking a percentage of transactions, attention, or data — rather than expanding the overall pool of value.
This can distort innovation priorities, encouraging incremental improvements that increase engagement or monetization rather than breakthroughs that create entirely new value.
Hidden Fragility Behind Scale
Highly centralized systems can appear robust due to their size and reach, but they often lack resilience. When innovation is concentrated within a few dominant entities, failures can have outsized consequences. At the same time, alternative approaches and redundant systems are less likely to emerge, reducing the overall adaptability of the ecosystem.
Erosion of the Innovation Commons
Perhaps the most significant long-term risk is the erosion of shared spaces for experimentation and collaboration. As knowledge, tools, and data become increasingly proprietary, the “commons” that historically fueled innovation begin to shrink.
What was once open becomes gated. What was once shared becomes owned. And what was once a collective engine for progress becomes fragmented across competing silos.
From this perspective, neo-feudalism does not just shape innovation — it constrains its potential. It limits participation, narrows possibility, and shifts the balance from exploration to control.
Which raises a deeper question: even if innovation continues, is it the kind of innovation we actually need?
Editorial Perspective: Beyond Innovation — Impacts on People, Society, and the Future
Innovation is only one dimension of neo-feudalism’s impact. To understand the full picture, we must examine how these dynamics affect personal finance, customer experience, employee experience, societal cohesion, and the broader trajectory of humanity.
Personal Finance: Ownership vs. Access
Neo-feudal structures often shift value from ownership to access. Individuals increasingly rent rather than own assets — from housing to software, from transportation to digital goods. This reduces opportunities for wealth accumulation and long-term financial security, creating dependency on centralized platforms and institutions.
Customer Experience: Convenience vs. Control
Platforms often deliver seamless, integrated experiences that delight customers. Yet this convenience comes at a cost: reduced choice, limited transparency, and dependence on a small number of dominant providers. What feels like freedom can also become subtle control.
Employee Experience: Flexibility vs. Precarity
The rise of gig work and contract-based employment provides flexibility, but often at the expense of security, benefits, and long-term stability. Workers may gain autonomy but lose agency over income, career trajectory, and participation in the value they create.
Societal Cohesion: Fragmentation vs. Stability
Neo-feudal structures create “walled gardens” — both digital and physical — that fragment communities and weaken shared social identity. The focus shifts from collective well-being to alignment with the dominant gatekeepers, eroding trust and social cohesion over time.
Innovation Paradox
The same structures that accelerate innovation at the top can suppress it at the edges. While resources and talent are concentrated in elite hubs, the diversity, experimentation, and autonomy that fuel broader innovation ecosystems may diminish, limiting society’s overall creative potential.
Ultimately, the question is not whether neo-feudalism can produce innovation —it can. The critical questions are: what kinds of innovation, who benefits from it, and what broader costs are being imposed on society?
Understanding these trade-offs is essential for leaders, policymakers, and innovators seeking to design systems that are not only efficient but also equitable, resilient, and human-centered.
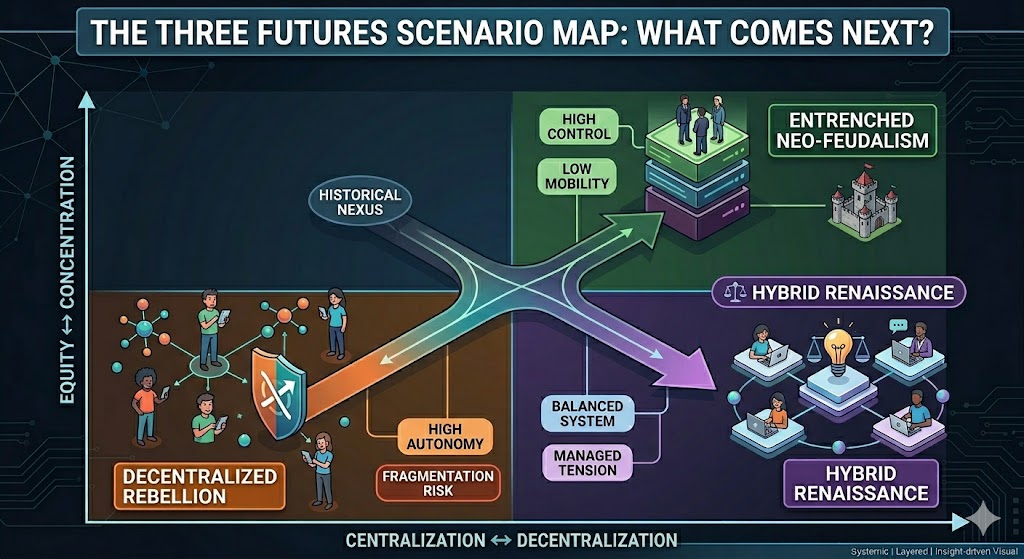
What Comes Next? The Future of Humanity in a Neo-Feudal Trajectory
Looking ahead, the trajectory of neo-feudalism raises profound questions about the future of innovation, society, and humanity itself. While the current system exhibits both benefits and constraints, the ultimate outcome is not predetermined. Several potential futures are emerging.
1. Entrenched Neo-Feudalism
In this scenario, the concentration of power solidifies. Large platforms, corporations, and institutions become the primary arbiters of opportunity, innovation, and wealth. Innovation continues to occur, but primarily within the bounds set by dominant entities, reinforcing dependency and inequality.
2. Decentralized Rebellion
Technologies such as blockchain, decentralized autonomous organizations (DAOs), and open-source platforms could empower new models of governance and collaboration. Power becomes more distributed, enabling innovation and value creation outside centralized structures. Communities reclaim ownership, autonomy, and agency over their economic and creative lives.
3. Hybrid Renaissance (Most Likely)
A middle path may emerge in which concentrated power is balanced by decentralizing forces. Platforms and institutions retain some influence but are complemented by regulatory frameworks, public oversight, and decentralized networks. This hybrid system could preserve the benefits of scale and stability while expanding participation and opportunity for a wider range of innovators.
Each of these scenarios carries implications for innovation, wealth distribution, social cohesion, and human potential. Leaders and policymakers face the challenge of shaping a system that maximizes innovation while mitigating dependency, inequality, and fragility.
The critical question is this: will humanity design a future where innovation serves the many, or will it remain confined to the few who control the gates?
EDITOR’S NOTE: Stay tuned for future articles examining the impact on innovation of planned obsolescence, right to repair, CONTACT ME WITH OTHER SUGGESTIONS, etc.
Image credits: Gemini
Content Authenticity Statement: The topic area, key elements to focus on, etc. were decisions made by Braden Kelley, with a little help from ChatGPT to clean up the article and add citations.
![]() Sign up here to get Human-Centered Change & Innovation Weekly delivered to your inbox every week.
Sign up here to get Human-Centered Change & Innovation Weekly delivered to your inbox every week.