Tag Archives: metrics

Measuring the Impact of Innovation

Key Metrics and Best Practices

Measuring the Impact of Innovation

GUEST POST from Art Inteligencia

Innovation is the lifeblood of any forward-thinking organization. But how can we effectively measure its success? To transform innovation from a nebulous concept into a structured business function, it is crucial to establish key metrics and best practices. This article aims to provide a comprehensive guide to measuring the impact of innovation, enriched by concrete case studies for better understanding.

Key Metrics for Measuring Innovation

While financial performance is a significant indicator, a holistic approach to innovation measurement includes multiple dimensions. Below are essential metrics every organization should consider:

  • Number of New Products/Services Launched: This metric acts as a direct indicator of an organization’s innovation capability.
  • Revenue from New Products/Services: Revenue generated from recently launched products or services demonstrates the market acceptance and commercial success of the innovations.
  • Time to Market: This measures the efficiency of the innovation process, tracking the duration it takes for an idea to become a marketable product.
  • Customer Satisfaction: Customer feedback and Net Promoter Score (NPS) are invaluable in determining how innovations have affected customer experience.
  • Research and Development (R&D) Spending: This metric tracks the investment made in innovation activities, often correlated with future growth potential.

Best Practices for Measuring Innovation

The following best practices offer a strategic approach to measuring and comprehensively understanding the impact of your innovation efforts:

  • Align with Business Goals: Ensure that your innovation metrics are aligned with your organization’s broader strategic objectives.
  • Incorporate Stakeholder Feedback: Engage with stakeholders—including employees, customers, and partners—to get a 360-degree perspective on innovation effectiveness.
  • Use Balanced Scorecards: A balanced scorecard can help in evaluating innovation from multiple dimensions—financial, customer, internal processes, and learning and growth.
  • Continual Improvement: Regular reviews and updates of your metrics are crucial for keeping up with evolving organizational goals and market conditions.
  • Data-Driven Decisions: Leverage advanced analytics and data-driven insights to refine innovation strategies continually.

Case Study 1: Procter & Gamble

Scenario: In the early 2000s, Procter & Gamble (P&G) faced stagnating growth. To reignite commercial success, the company invested heavily in innovation.

Metrics and Measurement: P&G focused on the number and quality of new product launches, alongside revenue generated from these products. They also tracked time to market and customer satisfaction metrics.

Outcome: By aligning their metrics with overall business objectives and keeping a customer-centered focus, P&G achieved significant success. Their innovation pipeline led to the introduction of products like the Swiffer and Crest Whitestrips, which revitalized their market standing.

Case Study 2: 3M

Scenario: 3M has long been a pioneer of innovation, driven by a goal to derive at least 30% of its sales from products developed in the last four years.

Metrics and Measurement: The company measures the percentage of revenue from new products, R&D spending, and employee engagement in innovation initiatives.

Outcome: 3M’s innovation culture has led to the creation of iconic products like Post-it Notes and Scotch Tape. The company’s methodical measurement practices ensured they remained particularly agile and responsive to market needs.

Conclusion

Measuring the impact of innovation is essential for its sustainability and growth. By employing a mix of key metrics and best practices, organizations can not only quantify their innovation efforts but also continually improve them. The cases of Procter & Gamble and 3M illustrate that with the right framework, the transformative power of innovation can be methodically harnessed to drive significant business success.

In the fast-paced world of business, continuous innovation and its accurate measurement are not just beneficial—they are imperative. Embrace these strategies, and watch your organization not merely adapt to change, but lead it.

Bottom line: Futurology is not fortune telling. Futurists use a scientific approach to create their deliverables, but a methodology and tools like those in FutureHacking™ can empower anyone to engage in futurology themselves.

Image credit: Pexels

Subscribe to Human-Centered Change & Innovation WeeklySign up here to get Human-Centered Change & Innovation Weekly delivered to your inbox every week.

Measuring the Impact of Design Thinking on Business Success

Measuring the Impact of Design Thinking on Business Success

GUEST POST from Art Inteligencia

Design Thinking has rapidly become a cornerstone of modern business strategy, promising to foster innovation and solve complex problems through a human-centered approach. But how can businesses measure the real impact of Design Thinking on their success? In this article, we will explore key metrics and provide two compelling case studies to illustrate how companies have achieved measurable success through Design Thinking.

Key Metrics for Measuring Impact

To assess the impact of Design Thinking, organizations should consider a combination of quantitative and qualitative metrics. Here are some critical metrics to consider:

  • Customer Satisfaction: Feedback scores and net promoter scores (NPS) before and after Design Thinking initiatives.
  • Time to Market: Reduction in the time it takes to develop and launch new products.
  • Revenue Growth: Increase in sales and market share attributable to new product innovations.
  • Employee Engagement: Improvement in employee satisfaction and retention rates.
  • Innovation Pipeline: The number and quality of new ideas entering the development phase.

Case Study 1: IBM

IBM, a global technology leader, adopted Design Thinking to accelerate innovation and enhance customer experiences. By integrating Design Thinking into their processes, IBM achieved significant results.

  • Customer-Centric Solutions: IBM focused on understanding the problems and needs of their users, leading to more intuitive and effective software solutions.
  • Shortened Development Cycles: The use of iterative prototyping and user testing reduced the time required to bring new products to market by 50%.
  • Increased Revenue: IBM saw a significant rise in revenue from new products designed using Design Thinking principles, contributing to a 20% increase in quarterly earnings.

IBM’s success demonstrates how adopting a human-centered approach can yield substantial benefits, both in terms of customer satisfaction and financial performance.

Case Study 2: Airbnb

Airbnb leveraged Design Thinking to transform their platform and enhance the user experience. This pivot was critical at a time when Airbnb faced stagnation and increased competition.

  • Empathy Mapping: Airbnb conducted extensive user research, including empathy mapping, to understand the pain points of both hosts and guests.
  • Prototype Development: They developed and tested numerous prototypes rapidly, iterating based on user feedback.
  • User-Centric Interface: The redesign of the platform led to a more user-friendly interface, resulting in improved engagement and booking rates.
  • Business Growth: Airbnb’s revenue surged as a result of the enhanced user experience, helping them achieve a valuation of over $100 billion.

The transformation of Airbnb highlights the power of Design Thinking in driving substantial growth and user engagement for digital platforms.

Conclusion

Design Thinking is more than just a buzzword; it’s a powerful methodology that can drive business success across various metrics. By focusing on human-centered design, organizations like IBM and Airbnb have not only improved their products and services but also achieved remarkable financial performance and market positioning.

To measure the impact of Design Thinking effectively, businesses should consider a blend of customer satisfaction, time to market, revenue growth, employee engagement, and the robustness of their innovation pipeline. As these case studies show, the power of Design Thinking lies in its comprehensive approach to problem-solving and its ability to transform challenges into opportunities for growth and success.

Bottom line: Futurology is not fortune telling. Futurists use a scientific approach to create their deliverables, but a methodology and tools like those in FutureHacking™ can empower anyone to engage in futurology themselves.

Image credit: Pexels

Subscribe to Human-Centered Change & Innovation WeeklySign up here to get Human-Centered Change & Innovation Weekly delivered to your inbox every week.

Measuring Success in Human-Centered Design

Key Metrics and KPIs to Track

Measuring Success in Human-Centered Design - Key Metrics and KPIs to Track

GUEST POST from Art Inteligencia

Human-Centered Design (HCD) isn’t just a buzzword; it’s a critical component of successful product and service development. Focusing on the human needs, behaviors, and limitations not only drives innovation but also ensures that the solutions are meaningful and impactful. However, one of the persistent challenges organizations face is measuring the success of their Human-Centered Design initiatives. In this article, we will explore key metrics and KPIs to track, supplemented with two case studies to illustrate their application.

Key Metrics in Human-Centered Design

Here are some of the key metrics to consider when measuring the success of HCD initiatives:

  • User Satisfaction: Through surveys and feedback forms, measure how satisfied users are with the design and functionality of the product.
  • Usability Scores: Conduct structured usability tests and track metrics such as error rates, task completion rates, and time to complete tasks.
  • Adoption Rates: Track the number of new users or clients adopting the product or service over time.
  • Customer Retention: Measure the rate at which existing users continue to use the product or service.
  • Net Promoter Score (NPS): Gauge overall customer loyalty and the likelihood of users recommending the product to others.
  • Engagement Metrics: Track how often and how long users engage with the product or service.

Case Study 1: Improving Mobile App Usability

Company A, a leading mobile application development firm, wanted to improve the usability of their flagship app. They implemented an HCD approach and focused on the following key metrics:

  • Usability Scores: Initial usability tests revealed that users struggled to complete specific tasks. Over several iterations, task completion rates improved from 60% to 95%.
  • User Satisfaction: Post-update surveys showed a significant increase in user satisfaction scores, climbing from 3.5 to 4.8 out of 5.
  • Customer Retention: The improved intuitive design led to a 20% increase in customer retention over six months.

The focus on user-centric metrics allowed Company A to tailor their design efforts effectively, resulting in a more user-friendly app and higher customer satisfaction.

Case Study 2: Enhancing Online Shopping Experience

Retailer B, an eCommerce company, aimed to enhance their online shopping experience using HCD principles. They focused on the following KPIs:

  • Adoption Rates: After redesigning their website, they saw a 30% increase in new users within the first quarter.
  • Net Promoter Score (NPS): NPS surveys conducted pre- and post-redesign showed an increase from 35 to 60, indicating higher customer satisfaction and loyalty.
  • Engagement Metrics: Time spent on the website per session increased by 25%, and the bounce rate decreased by 15%, suggesting more engaging content and a better overall user experience.

By systematically tracking these KPIs, Retailer B was able to validate the effectiveness of their design changes and continuously optimize the online shopping experience.

Conclusion

Measuring success in Human-Centered Design is crucial to ensure that design efforts are aligned with user needs and organizational goals. By focusing on metrics such as user satisfaction, usability scores, adoption rates, customer retention, NPS, and engagement metrics, organizations can gain comprehensive insights into the effectiveness of their HCD initiatives. The case studies of Company A and Retailer B illustrate the impact of a systematic approach to measuring design success, ultimately leading to more intuitive, engaging, and successful products and services.

Adopting these metrics and KPIs will not only enable organizations to quantify the results of their design efforts but also to continuously iterate and improve, ensuring sustained innovation and user satisfaction.

Stay curious, stay innovative!

Bottom line: Futurology is not fortune telling. Futurists use a scientific approach to create their deliverables, but a methodology and tools like those in FutureHacking™ can empower anyone to engage in futurology themselves.

Image credit: Pixabay

Subscribe to Human-Centered Change & Innovation WeeklySign up here to get Human-Centered Change & Innovation Weekly delivered to your inbox every week.

Measuring and Evaluating Change Success

Offering Insights into Key Metrics and Indicators that can be Used to Assess the Effectiveness of Change Initiatives and Make Data-Driven Decisions

Measuring and Evaluating Change Success

GUEST POST from Art Inteligencia

Change is inevitable in today’s fast-paced business environment, and organizations must effectively manage and evaluate their change initiatives to drive success. Assessing the impact of change requires measurement and evaluation based on key metrics and indicators that provide valuable insights into the effectiveness of ongoing initiatives. In this thought leadership article, we will explore the significance of measuring and evaluating change success and present two case studies showcasing the application of data-driven decision-making in assessing change initiatives.

Case Study 1: Implementing a Digital Transformation Program

Organization X, a multinational company, embarked on a digital transformation journey encompassing various areas, from technology infrastructure to workforce skills development. To measure change success, the following key metrics were identified:

1. Adoption Rate: Tracking the adoption rate of digital tools and technologies across departments and teams provides a measure of overall acceptance and utilization. By analyzing data on the number of employees actively using new tools, applications, or processes, Organization X can assess the progress of its digital transformation efforts.

2. Productivity and Efficiency Improvements: Measuring productivity and efficiency metrics before and after the digital transformation program allows for an evaluation of the impact on operational performance. Parameters such as reduced manual work hours, decreased error rates, or improved cycle times provide valuable insights into the program’s effectiveness.

3. Customer Satisfaction: Monitoring changes in customer satisfaction ratings, feedback, and repeat business can indicate how well the digital transformation program aligns with customer expectations. Surveys, feedback mechanisms, and social media analytics can help capture customer sentiment and identify shifts resulting from the implemented changes.

Through continuous measurement and evaluation of these key metrics, Organization X can assess the impact of its digital transformation program, modify strategies as needed, and make informed, data-driven decisions.

Case Study 2: Restructuring and Change Management in a Service Organization

Organization Y, a service-oriented company, underwent a comprehensive restructuring process to optimize operations and better align with evolving market demands. Key metrics and indicators utilized for measuring change success included:

1. Employee Engagement: Assessing employee satisfaction, motivation, and commitment through surveys, focus groups, or one-on-one discussions measures the success of change initiatives. Improvements in engagement levels indicate that the restructuring efforts positively impacted the workforce.

2. Financial Performance: Analyzing financial indicators such as revenue growth, cost reduction, and profitability pre- and post-restructuring gives insights into the financial impact of organizational changes. Positive changes in metrics demonstrate that the implemented changes led to desired outcomes.

3. Client Retention and Acquisition: Evaluating changes in client retention and acquisition rates provides valuable information about customer perception and satisfaction. Positive shifts in these metrics confirm that the restructuring efforts aligned with client expectations and needs.

By leveraging these metrics, Organization Y was able to measure the effectiveness of its restructuring initiatives, identify areas of improvement, and drive data-driven decision-making to sustain positive change outcomes.

Conclusion

Measuring and evaluating change success through key metrics and indicators is vital for organizations aiming to make data-driven decisions and ensure the effectiveness of their change initiatives. The provided case studies demonstrate how organizations have successfully utilized metrics focused on adoption rates, productivity improvements, customer satisfaction, employee engagement, financial performance, and client retention/acquisition. By consistently assessing these metrics, organizations can gain valuable insights, adapt their change strategies, and achieve long-term success in an ever-changing business landscape.

Bottom line: Futurology is not fortune telling. Futurists use a scientific approach to create their deliverables, but a methodology and tools like those in FutureHacking™ can empower anyone to engage in futurology themselves.

Image credit: Pixabay

Subscribe to Human-Centered Change & Innovation WeeklySign up here to get Human-Centered Change & Innovation Weekly delivered to your inbox every week.

Measuring and Tracking Customer Experience Metrics for Continuous Improvement

Measuring and Tracking Customer Experience Metrics for Continuous Improvement

GUEST POST from Chateau G Pato

Customer experience (CX) is rapidly gaining importance as a key differentiator in today’s competitive business landscape. Organizations that prioritize customer satisfaction and loyalty have experienced improved profitability and market success. To achieve sustainable growth, businesses must measure and track key customer experience metrics. This article explores how businesses can leverage CX metrics for continuous improvement, supported by real-world case studies.

Case Study 1: Zappos – Leveraging Net Promoter Score (NPS)

Zappos, the renowned online shoe retailer, is widely regarded as a customer-centric organization. In their quest to measure CX metrics effectively, Zappos adopted the Net Promoter Score (NPS) methodology. NPS measures customer loyalty by asking a single question: “On a scale of 0-10, how likely are you to recommend our company to a friend or colleague?” Based on customers’ responses, they are classified into three categories:

1. Promoters (score 9-10): Loyal enthusiasts who fuel positive word-of-mouth recommendations.
2. Passives (score 7-8): Satisfied customers but vulnerable to competitive offerings.
3. Detractors (score 0-6): Unhappy customers who can damage the brand’s reputation.

By consistently tracking NPS scores, Zappos ensures their CX initiatives align with customer expectations. Continuously improving the customer experience has been a key factor in their remarkable success.

Case Study 2: Starbucks – Measuring Customer Satisfaction (CSAT)

Starbucks, the global coffeehouse chain, places great emphasis on measuring customer satisfaction as part of their ongoing commitment to superior service. To understand and improve CX, Starbucks relies on Customer Satisfaction (CSAT) surveys conducted through their loyalty program.

By monitoring CSAT scores, Starbucks gains valuable insights into their customers’ perceptions and preferences. They identify areas for improvement, enabling them to continuously enhance the customer experience. Moreover, they link CSAT scores with specific stores, allowing managers to address any issues promptly and deliver exceptional service.

Key Customer Experience Metrics for Continuous Improvement:

While NPS and CSAT are two popular customer experience metrics, businesses should consider additional metrics based on their specific industry and customer journey. Here are some key metrics worth monitoring:

1. Customer Effort Score (CES): Measures the ease of customers’ interactions with a company. Low-effort experiences enhance customer loyalty.
2. Customer Churn Rate: Helps identify the percentage of customers leaving over a given period, emphasizing the need to address pain points.
3. First Response Time (FRT): Pertains to customer inquiries or complaints—timely responses contribute to positive experiences.
4. Average Handling Time (AHT): Evaluates the efficiency of customer service and support, aiming for shorter handling times without compromising quality.
5. Customer Lifetime Value (CLV): Predicts the net profit attributed to the entire relationship with a customer, guiding long-term CX strategies.

Continuous Improvement through CX Metrics:

To drive continuous improvement effectively, businesses should follow a few essential steps:

1. Collect and analyze relevant data: Regularly measure and track CX metrics using surveys, feedback forms, social listening tools, and other data collection methods.
2. Identify areas for improvement: Actively listen to customer feedback, identify pain points, and prioritize actions based on their potential impact.
3. Empower employees: Equip employees with the necessary tools, training, and resources to deliver exceptional customer experiences.
4. Implement changes and measure outcomes: Execute targeted initiatives and closely monitor the impact of changes on CX metrics to ensure efficacy.
5. Adapt and iterate: Continually reassess customer needs, refine strategies, and adapt to evolving trends to maintain a competitive edge.

Conclusion

Measuring and tracking customer experience metrics is vital for businesses seeking continuous improvement. Companies like Zappos and Starbucks demonstrate the power of CX metrics in delivering superior customer experiences. By leveraging relevant metrics and acknowledging customer feedback, organizations can create stronger long-term customer relationships, differentiate themselves from competitors, and achieve sustainable growth.

SPECIAL BONUS: Futurology is not fortune telling. Futurists use a scientific approach to create their deliverables, but a methodology and tools like those in FutureHacking™ can empower anyone to engage in futurology themselves.

Image credit: Unsplash

Subscribe to Human-Centered Change & Innovation WeeklySign up here to get Human-Centered Change & Innovation Weekly delivered to your inbox every week.

Failing Fast Leads to More Failure

Most Companies Fail at Innovation Because...One scary statistic is that 70% of change initiatives fail. An overwhelming proportion of new product launches fail. Most new businesses fail.

The sad fact is that failure is all around us.

Is this why so many organizations talk about a fear of failure being one of their major innovation stumbling blocks?

And, so what mantra do many innovation and growth gurus expound as a solution?

“We need to fail fast.”

“We need to fail forward.”

“We need to fail smart.”

So, the solution most innovation consultancies put forward to organizations already coping with the wide ranging effects of failure, is to tell their employees that they need to fail more.

Say what?

If you can’t tell already, I really hate the whole fail fast mantra. Can we kill it yet?

You don’t want to fail fast, you want to learn fast.

And so, if you switch to learning fast instead, the efforts of your employees should then become laser focused on identifying what you need to learn with each iteration, or each experiment.

And your focus should also then become all about how well you are instrumenting for the learning you are trying to achieve.

This is more consistent with failing forward, but WE ARE NOT FOCUSED ON FAILURE.

Focusing on failure, leads to failure. Failure becomes the expected outcome.

Instead, we are focused on learning fast, and we can learn equally well from success as we can from failure – if our learning instrumentation is good.

The way that you achieve success in change AND in innovation, is by working hard to move the potential causes of failure farther forward in the innovation or change project lifecycle so that you have an opportunity to either design the flaws or obstacles out, or communicate them out by forcing the tough conversations during your planning process (for change or innovation) — this comes before you even begin executing your plan.

You’ve got to surface the sources of resistance, the faulty assumptions, and the barriers to be overcome — early.

Then we build a plan focused not on quick wins, but on maintaining transparency and momentum throughout the change implementation.

You may have noticed that I use the terms innovation and change almost interchangeably (often in the same sentence). This is because innovation is all about change, and because many of the barriers to change inside organizations are the same barriers that innovators face.

As an answer to these challenges, I created the Change Planning Toolkit™ to help organizations beat the 70% change failure rate by providing a suite of tools that allow change leaders to make a more visual, collaborative approach to change efforts. At the center of the approach sits the Change Planning Canvas™, very visual, very collaborative ala Lean Startup to help you prototype and evolve your change approach before you ever begin. The toolkit comes with a QuickStart Guide and my latest book Charting Change was designed to ground people in the philosophies that will help them succeed with both little C change efforts (projects) and big C change efforts (digital transformations, mergers, acquisitions, INNOVATION, etc.).

So, stop bringing more failure into your organization, and instead bring the tools into your organization that will help you achieve more success!

SPECIAL UPDATE

The Experiment Canvas

To help everyone accelerate their learning and to achieve better success in their human-centered innovation efforts, I will be creating and licensing a Human-Centered Innovation Toolkit™ to innovation consultants and practitioners around the world. I have been sharing early elements with my clients and I’m proud to be able to give you all a valuable taste of the kinds of tools that will be in this toolkit when it launches later this year by providing advance access to the first free download – The Experiment Canvas™. Designed to be used iteratively, and to quickly capture in a visual, collaborative way (in similar fashion the Change Planning Toolkit™).

Download The Experiment Canvas™ as a 35″x56″ scalable FREE PDF poster download

If you’re not clear on what the Change Planning Toolkit™ can do for you, please join me Thursday, June 8th at 9am PDT on Twitter for an Ask Me Anything (aka #AMA) session on the Change Planning Toolkit™ using the hashtag #cptoolkit and well, ask me anything!

A future #AMA on the Human-Centered Innovation Toolkit™ is coming soon too!

Innovation Audit from Braden Kelley

Subscribe to Human-Centered Change & Innovation WeeklySign up here to get Human-Centered Change & Innovation Weekly delivered to your inbox every week.

What is your level of Innovation Maturity?

Innovation Maturity Introduction

When it comes to innovation, no two companies are likely to be pursuing innovation in the same way, and they are also likely to be at different stages of innovation maturity. Because of this, even if you found out what your competitor’s innovation strategy was, it would be of no use to you. It is necessary for an innovation strategy to be tailored to your organization’s level of innovation maturity, your corporate strategy, and your innovation vision.

Free Innovation Maturity Assessment
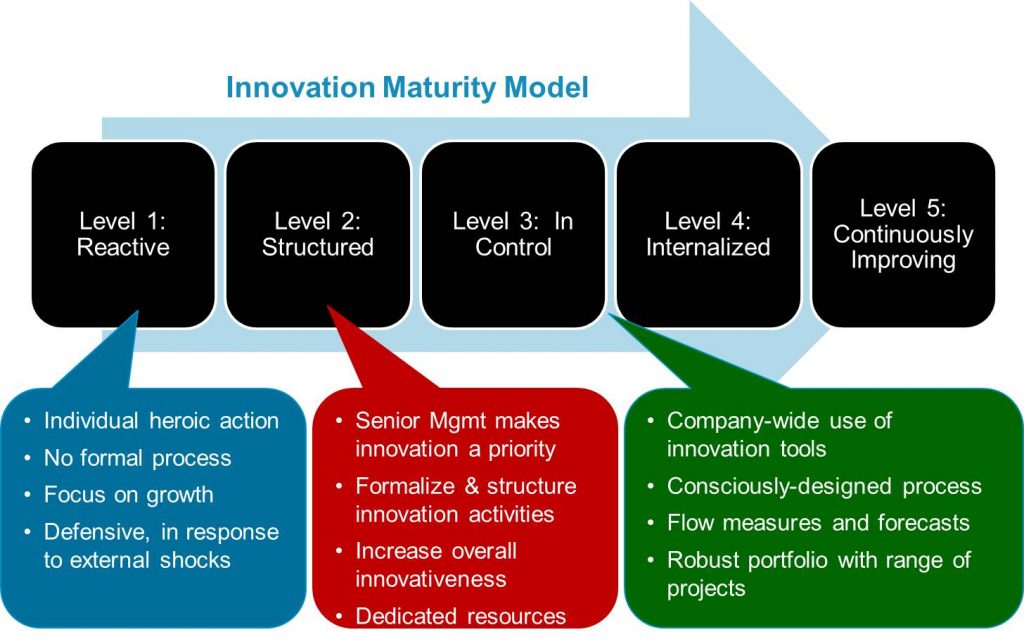
An organization’s innovation maturity level is important because you must first master a certain set of basic innovation capabilities before implementing more advanced innovation approaches into your strategy. For example, an organization just getting started on their innovation journey would be foolish to try and implement open innovation in their organization. Every organization should get their idea generation (including evolution), idea evaluation, and idea commercialization policies and processes working well with their employees first before opening themselves up to the outside world. Your organization’s innovation strategy must be appropriate to your level of innovation maturity for your innovation efforts to be successful.

I developed the graphic below to explain the different levels of innovation maturity based on some thinking from Wharton professors Christian Terwiesch and Karl T. Ulrich, and I think it allows executives to determine at a glance where their organization is across the spectrum. I hope you find it useful.

Free Innovation Maturity Assessment

Special OfferTo help people evaluate their level of innovation maturity against the above graphic, I am sharing the 50 question innovation maturity assessment I use with clients. The assessment is most powerful when answers are gathered at multiple levels of the organization across several groups and several sites, but you can also fill it out yourself and get instant feedback – for FREE.

To get even more out of the innovation maturity assessment, for a nominal fee, I can help you organize a multiple group and/or multiple physical location survey of people in the organization to capture not just your level of innovation maturity, but also to provide preliminary innovation diagnostics on the areas of innovation challenge and opportunity in your organization.

I can set up a research study to capture a baseline innovation maturity level and analyze the data to unlock insights about the relative health of your innovation efforts. For a limited time, I will provide this service for the special introductory price of $499.99.

Click here to purchase the innovation diagnostic service
(Get help using the innovation maturity assessment across multiple sites and job functions and analyzing the results)

Innovation Maturity Model

Innovation Maturity Assessment Scoring Key (showing level of maturity)

Point totals are translated to the innovation maturity model as follows:

  • 000-100 = Level 1 – Reactive
  • 101-130 = Level 2 – Structured
  • 131-150 = Level 3 – In Control
  • 151-180 = Level 4 – Internalized
  • 181-200 = Level 5 – Continuously Improving

Click here to access the Innovation Maturity Assessment

Innovation Maturity Assessment Instructions

1. Read each statement and determine how much you agree with each one, using this scale:

  • 0 – None
  • 1 – A Little
  • 2 – Partially
  • 3 – Often
  • 4 – Fully

2. Select the answer for each question that is most appropriate.

The form will score the innovation maturity assessment and return a result to you via email along with the SCORING KEY and the Innovation Maturity Model graphic. Store the result as a baseline and come back annually and re-take the assessment to measure your progress!

Click here to access the Innovation Maturity Assessment

Click here to purchase the innovation diagnostic service
(Get help using the innovation maturity assessment across multiple sites and job functions and analyzing the results)

* Graphic adapted from the book Innovation Tournaments by Christian Terwiesch and Karl Ulrich

Subscribe to Human-Centered Change & Innovation WeeklySign up here to get Human-Centered Change & Innovation Weekly delivered to your inbox every week.

Measuring Organizational Agility – The Triple T Metric v1.0

Measuring Organizational Agility - The Triple T MetricThere is an increasing amount of chatter and confusion out there around what organizational agility is and feeling that it must be important to organizational success.

But, before we discuss organizational agility, it is important to define what we mean by the term.

BusinessDictionary.com has a decent definition:

“The capability of a company to rapidly change or adapt in response to changes in the market. A high degree of organizational agility can help a company to react successfully to the emergence of new competitors, the development of new industry-changing technologies, or sudden shifts in overall market conditions.”

Usually people begin speaking about organizational agility and its importance to the success of the organization when they speak about the increasing pace of change, and the challenge the organization faces in keeping up.

Because of this, one of the key measures of organizational agility you may want to consider using, I like to call the Triple T Metric:

Time
to
Transform

The Triple T Metric is a measure of how long it takes an organization to make a transformation. But to measure your progress on the Triple T Metric over time, you must define it and measure it in a consistent manner. So, if a transformation is like a trip from Point A to Point B, we must define Point A and Point B.

  • Point A = the point in time at which the organization recognizes a change is needed away from the steady state
  • Point B = the point in time at which the organization successfully arrives at the new steady state

You’ll notice that Point A doesn’t start at the point at which people AGREE that a change is needed and AGREE to make it, but at the point the organization RECOGNIZES a change is needed. This is because there is great opportunity to increase your organizational agility by increasing the speed at which the organization moves from recognizing the need for change, to agreeing to change, to planning the change, to executing the change.

This is just v1.0 of our discussion of the Triple T Metric, to introduce the concept. We’ll get into more detail in a future post.

All of these transitions must be included because organizational agility is ultimately about how quickly the organization can successfully plan, lead, and execute (manage and maintain) a change effort, increasing your organizational agility requires that you increase both your change capability and your change capacity.

How fast can your organization change?

If you want to learn how to change faster, and make your organization more agile, grab a copy of Charting Change and the supporting materials for book buyers!


Accelerate your change and transformation success

Subscribe to Human-Centered Change & Innovation WeeklySign up here to get Human-Centered Change & Innovation Weekly delivered to your inbox every week.

Innovation Quotes of the Day – April 30, 2012


“Albert Einstein wrote, ‘Everybody is a genius! But if you judge a fish by its ability to climb a tree, it will live its whole life believing that it is stupid!’
We are all capable of doing one thing better than any other person alive at this time in history!”

– Matthew Kelly


“In order for innovation to reliably happen at every level of the organization, it will be extremely useful for all members to have access to the voice of the customer.”

– Braden Kelley


“Imagination is not only the uniquely human capacity to envision that which is not, and therefore the fount of all invention and innovation. In its arguably most transformative and revelatory capacity, it is the power to that enables us to empathize with humans whose experiences we have never shared.”

– J.K. Rowling


What are some of your favorite innovation quotes?

Add one or more to the comments, listing the quote and who said it, and I’ll share the best of the submissions as future innovation quotes of the day!

Subscribe to Human-Centered Change & Innovation WeeklySign up here to get Human-Centered Change & Innovation Weekly delivered to your inbox every week.