LAST UPDATED: May 1, 2026 at 4:23 PM
GUEST POST from Art Inteligencia
I. Introduction: The Visibility Gap in Change Management
Most organizational transformations suffer from a fundamental optical illusion: they mistake the completion of a checklist for the successful evolution of a culture. While technical milestones may be met on time and under budget, the “human” element often remains a black box until it is too late to intervene. This visibility gap is where even the most well-funded innovation strategies go to die.
The Lagging Trap
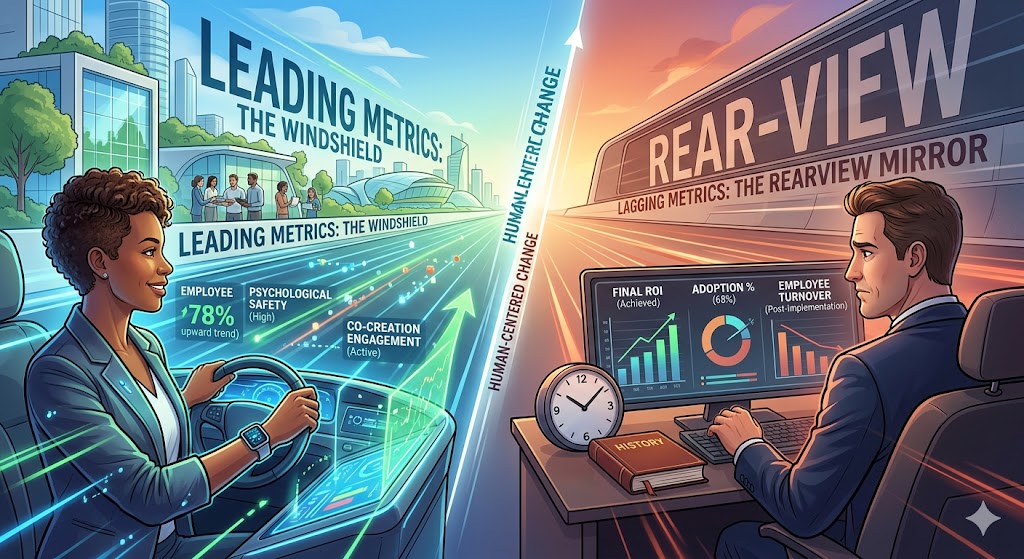
In the traditional corporate paradigm, we are conditioned to manage via the rearview mirror. We rely on lagging metrics—financial ROI, final adoption percentages, and post-implementation turnover rates—to tell us if we succeeded. The inherent flaw? By the time these numbers hit your dashboard, the window for meaningful course correction has already closed. You aren’t leading change; you are simply documenting its aftermath.
The Human-Centered Shift
True human-centered change requires a radical redefinition of “success.” It demands that we look beyond the destination and begin measuring the proficiency, mindset, and emotional friction of the people expected to live within the new reality. We must shift our focus from tracking what happened to measuring the signals of what is happening right now.
The Core Thesis
To navigate the complexity of the modern business landscape, leaders must pivot their strategy toward leading metrics. By identifying and tracking predictive human behaviors today, we can ensure the desired organizational outcomes of tomorrow. It is time to stop reacting to the data of the past and start designing for the experiences of the future.
II. Defining the Yardsticks
To master the art of change, we must first distinguish between the data that reports history and the data that predicts the future. In human-centered design, the “yardstick” we choose determines whether we are merely observers or active architects of transformation.
Lagging Metrics: The Rearview Mirror
Lagging metrics are the traditional benchmarks of business. They are concrete, easily quantifiable, and objective—but they are also retrospective. By the time a lagging metric changes, the activities that caused the change have already occurred. Examples include:
- Financial ROI: The total cost savings or revenue growth achieved six months post-launch.
- Final Adoption Rates: The percentage of the workforce using the new tool after the “Go-Live” date.
- Employee Turnover: Measuring how many people left the organization as a reaction to the transition.
Characteristic: High in accuracy, but zero in influence. You cannot change a lagging metric; you can only learn from it for the next project.
Leading Metrics: The Windshield
Leading metrics are the predictive indicators that signal whether you are on the right path. They focus on the “human” inputs that eventually produce the lagging outputs. These are often more difficult to capture because they require a pulse on the organization’s current state. Examples include:
- Sentiment & Psychological Safety: Real-time feedback on whether employees feel safe to voice concerns or experiment.
- Participation in Co-creation: Tracking how many non-leaders are actively contributing to the design of the change.
- Speed of Proficiency: How quickly teams are moving through the “Valley of Despair” toward competence in new workflows.
Characteristic: Predictive and actionable. If a leading metric looks poor, you have the opportunity to intervene, pivot, and save the initiative before it fails.
| Feature | Lagging Metrics | Leading Metrics |
|---|---|---|
| Focus | Outcomes (The Result) | Process (The Journey) |
| Measurement | Easy to track | Harder to track (requires empathy) |
| Actionability | Reactive | Proactive |
| Example | Total Project Cost | Workshop Engagement Levels |
III. The Human-Centered Hierarchy of Leading Metrics
To move beyond surface-level tracking, we must categorize leading metrics based on the depth of human engagement. This hierarchy allows leaders to see how individual perceptions eventually coalesce into organizational momentum.
Awareness & Understanding
The foundation of any change is clarity. We measure this not by whether an email was “sent,” but by the resonance of the message.
- Clarity Pulse: Brief, frequent surveys asking, “Do you understand the ‘Why’ behind this change?”
- Information Symmetry: Tracking the gap between what leadership believes is happening and what the “front line” reports.
Engagement & Co-creation
Passive acceptance is the enemy of innovation. We must measure the transition from “being changed” to “being a change agent.”
- The Innovation Quotient: The volume and quality of employee-led suggestions or modifications to the proposed plan.
- Workshop Vitality: Moving beyond attendance to measure active participation, debate, and collaborative output during design sessions.
Behavioral Proxies
Culture is simply the sum of daily habits. Leading metrics should identify the small, observable shifts that signal a new mindset is taking root.
- Early Adoption Trends: Monitoring the “volunteers” who utilize new systems or processes before they are mandated.
- Language Shifts: Identifying changes in internal vocabulary—when the “new way” starts appearing naturally in Slack channels or meeting notes.
Network Health
Change doesn’t move through org charts; it moves through social networks.
- Influencer Mapping: Using Organizational Network Analysis (ONA) to identify the “unseen” leaders who are either accelerating or throttling the flow of information.
- Trust Velocity: Measuring the speed at which feedback travels from the bottom of the organization to the top.
“If you want to predict the ROI of a transformation, stop looking at your spreadsheet and start looking at the quality of the conversations in your breakroom.” — Braden Kelley
IV. Why Lagging Metrics Sabotage Innovation
The reliance on lagging metrics isn’t just a reporting preference; it is a cultural inhibitor. When an organization prioritizes post-hoc results over real-time signals, it inadvertently creates an environment where true innovation struggles to survive.
The Fear Factor
High-stakes lagging metrics, such as immediate quarterly ROI, often act as a guillotine for experimentation. If employees know they will only be judged on the final “hard” numbers, they are less likely to engage in the messy, non-linear process of innovation. This creates a culture of playing it safe, where people optimize for predictable outcomes rather than transformative breakthroughs.
The Delayed Feedback Loop
Innovation requires agility—the ability to pivot based on what we learn. Lagging metrics provide feedback too late to be useful. Waiting until the end of a six-month rollout to realize that the user experience is causing friction is a recipe for expensive failure. By the time the lagging data arrives, the budget is spent, the team is exhausted, and the “human” element has already disengaged.
Correlation vs. Causality
A “successful” rollout on paper (a lagging metric) does not necessarily mean the change has been internalized. Organizations often see a temporary spike in performance due to sheer managerial will, only to see it crater once the spotlight moves elsewhere. Lagging metrics often mask malicious compliance—where employees go through the motions without adopting the underlying mindset needed for sustained innovation.
The Erosion of Trust
When leadership only communicates via lagging metrics, employees feel like cogs in a machine rather than partners in a journey. This disconnect erodes the psychological safety required for human-centered change. If the only thing that matters is the final number, the experience of the change is ignored, leading to burnout and resistance that will haunt the next initiative.
“Innovation dies in the gap between the pressure for immediate results and the patience required for human adoption.”
V. Strategic Implementation: Building the Dashboard
The goal is not to replace lagging metrics, but to balance them. A human-centered dashboard integrates qualitative signals with quantitative outcomes, creating a comprehensive view of organizational health and transformation progress.
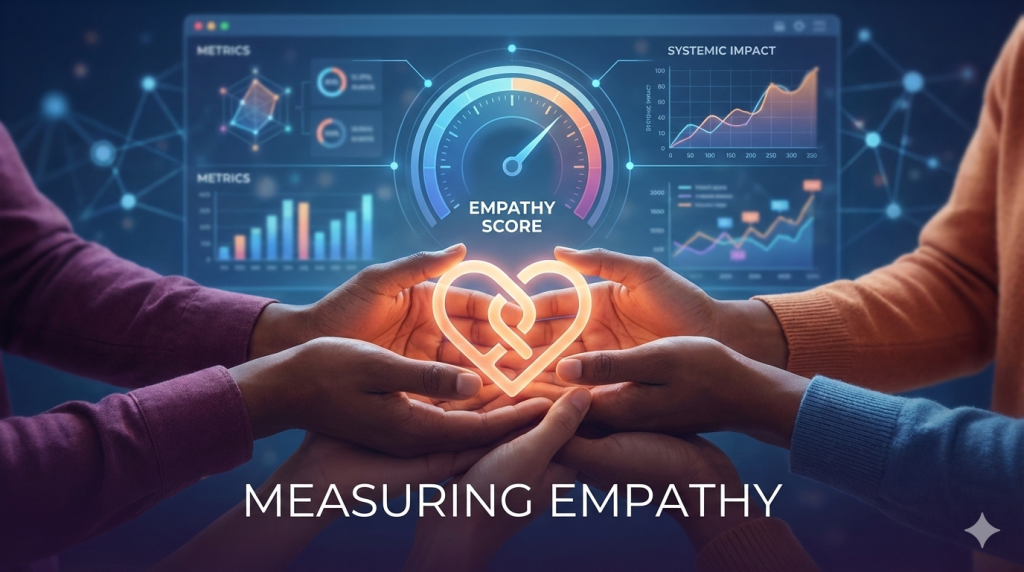
Designing for Empathy
Data collection should never feel like surveillance. To build a dashboard that reflects the human experience, organizations must prioritize privacy and psychological safety.
- Anonymity: Ensure sentiment data is aggregated to protect individual identities.
- The “Give-to-Get” Ratio: If employees provide data via pulse surveys, they must see that data being used to make their work lives better. Transparently sharing the results and subsequent actions builds trust.
The Balanced Scorecard of Change
Effective dashboards place leading and lagging indicators side-by-side to reveal correlations. For example, if “Awareness” (leading) is low in the Marketing department, leadership can predict that “Adoption” (lagging) will suffer in the coming months unless a targeted communication intervention occurs.
Iterative Adjustment (The Pivot)
The true power of leading metrics lies in the Agile Pivot. Rather than waiting for a project post-mortem, leaders use real-time data to adjust their tactics.
- Small-Scale Experiments: Use leading indicators to test a change in one small team before a global rollout.
- Resource Realignment: If engagement metrics dip, shift resources from “technical training” to “cultural alignment” or “co-creation workshops.”
Key Components of a Human-Centered Dashboard
| Indicator Type | What it Measures | Visual Representation |
|---|---|---|
| Resonance | Clarity of the “Why” | Word clouds or Likert-scale heatmaps |
| Friction | Perceived difficulty of new tasks | Trend lines showing “Effort Scores” |
| Momentum | Volume of peer-to-peer advocacy | Social network maps (ONA) |
| Output | Traditional ROI/KPIs | Standard bar charts (the eventual goal) |
“A dashboard without human-centered metrics isn’t a management tool; it’s just a history book that hasn’t been finished yet.” — Braden Kelley
VI. Conclusion: Leading the Future of Work
The transition from managing through lagging indicators to leading through human-centered metrics represents a shift in the very soul of leadership. It is the move from being a commander of results to becoming a steward of environment. In an era where the pace of change is only accelerating, the organizations that thrive will be those that view their people not as variables in an equation, but as the engine of the journey.
From Management to Stewardship
Leadership in the modern age requires the humility to acknowledge that a spreadsheet cannot capture the nuance of human transition. By focusing on leading metrics, you are prioritizing the health of the soil rather than just counting the harvest. When you measure and act upon sentiment, engagement, and proficiency in real-time, you reduce the friction of change and build institutional resilience.
The Early Warning System
Leading metrics serve as your organizational “early warning system.” They provide the quiet signals that precede the loud crashes of project failure. Mastering these indicators allows you to navigate uncertainty with a level of precision that lagging data simply cannot provide. You gain the gift of time—time to listen, time to pivot, and time to support your teams when they need it most.
Final Thought: Designing the Experience
Change is not a destination to be reached; it is a continuous state of experience design. If the experience of change is poorly designed, the resulting ROI will always be fragile. By elevating the “human” to the top of your measurement hierarchy, you ensure that innovation is not just something your company does, but something your company is.
“Don’t just measure the wake your ship leaves behind; keep your eyes on the horizon and your hand on the pulse of the crew. That is where the future is won.”
As a thought leader in innovation and change, Braden Kelley emphasizes that the most successful transformations are those that invite everyone into the process. For more insights on human-centered methodologies or to bring these frameworks to your next event, consider Braden Kelley as your guide to the future of change.
Frequently Asked Questions
1. What is the main difference between leading and lagging metrics?
Lagging metrics measure outcomes after the fact (like total ROI), while leading metrics are predictive indicators (like employee sentiment) that allow you to influence the outcome before it’s finalized.
2. Why are leading metrics essential for human-centered change?
They provide an “early warning system” for the human element of transformation. By tracking engagement and understanding in real-time, leaders can pivot their strategy to address resistance before it leads to project failure.
3. Can leading metrics replace lagging metrics entirely?
No. Both are necessary. Lagging metrics provide the ultimate proof of success for stakeholders, while leading metrics provide the operational guidance needed to ensure those successful results are actually achieved.
Image credit: Google Gemini
![]() Sign up here to get Human-Centered Change & Innovation Weekly delivered to your inbox every week.
Sign up here to get Human-Centered Change & Innovation Weekly delivered to your inbox every week.

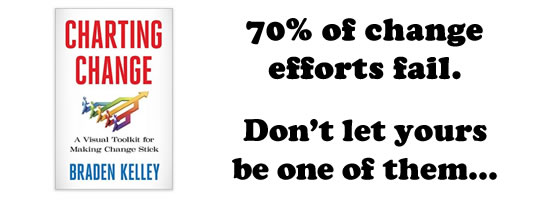
 One scary statistic is that 70% of change initiatives fail. An overwhelming proportion of new product launches fail. Most new businesses fail.
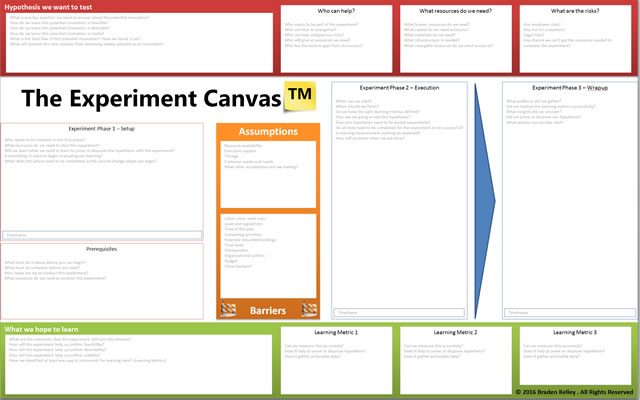

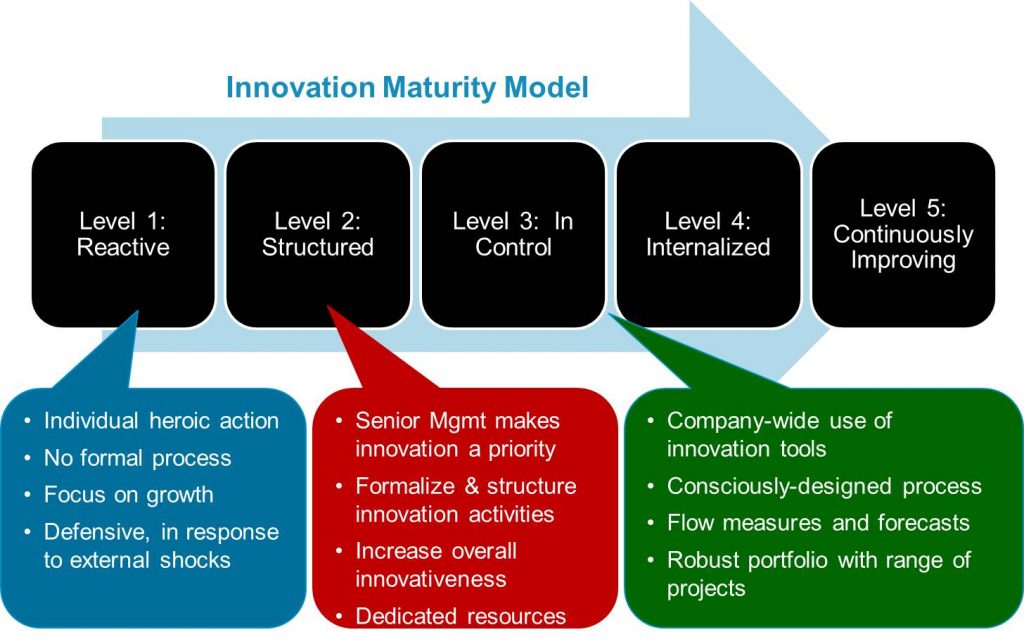
 An organization’s innovation maturity level is important because you must first master a certain set of basic innovation capabilities before implementing more advanced innovation approaches into your strategy. For example, an organization just getting started on their innovation journey would be foolish to try and implement open innovation in their organization. Every organization should get their idea generation (including evolution), idea evaluation, and idea commercialization policies and processes working well with their employees first before opening themselves up to the outside world. Your organization’s innovation strategy must be appropriate to your level of innovation maturity for your innovation efforts to be successful.
 There is an increasing amount of chatter and confusion out there around what organizational agility is and feeling that it must be important to organizational success.