Category Archives: Finance

How to Build a Local Value Score Without Starting a Partisan Firefight

How to Build a Local Value Score Without Starting a Partisan Firefight

by Braden Kelley and Art Inteligencia

In the first piece in this series, we lit the spark: absolute spending debates rarely move the needle, while peer-relative value, what similar communities achieve per dollar, can. This article opens the instrument. Not the full DIY toolkit yet. The method. The experience architecture. The discipline that turns civic anger into civic learning.

From spark to instrument

Innovation without an instrument is just a mood. Human-centered change without a shared unit of sense-making becomes another round of tribal theater. If you felt the first article land – What If You Could Prove the Government is Ripping Us Off? – the next question is practical:

How do we score a place fairly enough that good-faith people on the left, right, and exhausted middle can argue about the same dashboard?

That is an experience-design problem before it is a political problem. People cannot improve what they cannot sense. So we need an interface for civic value that ordinary neighbors can understand in under two minutes, and that a finance director can challenge without inventing motives.

Call the instrument a Relative Value Score (RVS): a transparent, peer-normalized view of outcomes per cost-adjusted dollar, with a clear path to “why the gap.” The revolutionary move is not inventing a grade that flatters your side. It is building a comparison citizens trust enough to use in budget season.

What a Relative Value Score actually measures

A Relative Value Score is not “how big is the budget?” Bigger places spend more. Harder case mixes cost more. Expensive labor markets pay more. Treating raw spend as proof of compassion, or of waste, is how we keep fighting about identity instead of delivery.

Conceptually:

RVS ≈ how close you are to the best peer in your cohort on value delivered per dollar—across a small set of outcome domains, cost-adjusted, with published weights and sources.

Think of it like comparing restaurants of the same type and price band on food quality per dollar, not comparing a food truck to a banquet hall and declaring a winner by total receipts. Futurology loves flashy national indexes. Experience design prefers local instruments that feel fair in the neighborhood where life is actually lived.

Three design rules keep the score human-centered:

  • Outcomes over optics. Prefer measurable delivery (response times, learning growth, pavement condition, permit latency, unit cost of capital) over press-release volume.
  • Cost-adjusted dollars. Adjust for regional price and wage differences so “expensive place” is not automatically “bad place.”
  • Relative, not absolute holiness. Normalize within the peer cohort. The best peer becomes the teacher. Everyone else gets a gap to close—or explain.

Improper payments, fraud risk, and opaque grantee chains still matter. They belong on a related but separate track (more below). Mixing “inefficient” with “corrupt” in one opaque number is how movements lose the room on the first contested claim.

Peers first: the fairness engine

Most “benchmarking” fails before the math starts—because the peer set is a vibes playlist. Comparing a dense coastal city to a rural county, or a high-poverty district to an affluent one using unadjusted test levels, is not accountability. It is ammunition.

Peer cohorts are the fairness engine. Build them first. Argue about them in public. Version them. That is change leadership: put the contested assumptions where people can see them.

Practical cohort dimensions by layer:

  • Cities: population band, density, metro/rural context, regional price/wage index.
  • Counties: population, urban share, mandate set (courts, jails, public health, roads, elections).
  • States: population scale, economic mix, federal transfer share—used carefully; states are multi-product machines.
  • School districts: enrollment, % students in special education / English learners / free-or-reduced lunch (or equivalent need measures), urbanicity, regional educator wages. Prefer learning growth / value-add over raw proficiency levels whenever possible.
  • Water and special districts: service population, infrastructure age/type, treatment complexity, geography—unit cost of delivered service beats “total budget” every time.

A good peer set is small enough to be intelligible and large enough that one outlier cannot redefine “normal.” Publish who is in the cohort and why. Invite the entity to propose alternate peers with evidence. Right-to-reply is not weakness. It is how trust compounds.

Domains, weights, and the “why the gap” story

Do not boil the ocean. Innovation teams ship thin slices. For a first local scorecard, pick 8–12 metrics max across a few domains—not 200 indicators nobody reads.

Example domain shapes (customize by entity type):

  • Service delivery: outcomes or service quality per dollar or per FTE (clearance, response, throughput, condition).
  • Administrative load: central office / admin share versus program or instructional spend.
  • Labor intensity: compensation density (payroll, overtime, benefits where available) versus outputs.
  • Contracting & capital: competitive bid share, concentration, unit cost and schedule slippage on comparable projects.
  • Transparency: timely CAFRs/budgets, machine-readable checkbooks, FOIA latency—inputs to trust, not vanity.

Weights should be public, few, and revisable. Publish a default weighting, and let citizens toggle sensitivity modes (“weight learning growth higher,” “weight admin share higher”) so critics can fork the story without assassinating the messenger. That is open innovation applied to civic sense-making.

The score is the headline. The product is the “why the gap” decomposition: which 2–3 drivers explain most of the distance from the best peer, each with sources and confidence. Without that story, a score is just a ranking for dunking. With it, a score becomes a change agenda.

Two tracks: performance vs. integrity

Human-centered accountability refuses false equivalence. A district can be expensive relative to peers and still honest. An agency can look “lean” on paper and still run integrity red flags. Smash those into one “corruption score” and you have built a weapon, not an instrument.

Keep two panels on the same dashboard:

  • Performance track (RVS): peer-relative outcomes per cost-adjusted dollar. This is the main civic interface.
  • Integrity overlay: audit findings, delayed reporting, sole-source patterns, related-party flags, outcome-light grantee chains—shown with higher evidentiary bars, source documents, and room to reply. Treat AI here as a highlighter for human review, never as a judge pronouncing guilt.

This separation is how a multipartisan movement survives contact with reality. Precision is the revolutionary ethic. Smear is the cheap substitute.

A weekend walkthrough for one jurisdiction

You do not need the full toolkit to practice the method. You need a first mile. Here is a human-sized walkthrough you can start this weekend—before the downloadable suite and guidebooks ship.

  • 1. Name the entity in one sentence. “Our K–12 district,” “our city general fund,” “our water district”—passion plus a border beats rage at “the system.”
  • 2. Pull Tier-A documents. Latest adopted budget, CAFR or annual financial report, salary schedule or checkbook export, and any published outcomes dashboards. Note what is missing.
  • 3. Draft a peer shortlist. Five to fifteen similars using the cohort dimensions above. Write one paragraph defending the set.
  • 4. Choose eight metrics you can source. Prefer unit costs and outcomes over vibes. If a metric cannot be sourced, park it—do not invent it.
  • 5. Build a crude gap view. For each metric, who is best in your peer set? Where are you? What is the story in two drivers?
  • 6. Separate integrity notes. If you see red flags, log them with links and confidence—not as the score itself.
  • 7. Write three budget-season questions. Short enough for a three-minute public comment. Specific enough that staff must answer on the record.

That walkthrough is reconnaissance, not a finished product. Finished products need versioned methods, entity right-to-reply, and consistent cohort rules. That is exactly what the forthcoming DIY tools and role-based guidebooks are for—so local teams are not reinventing discipline in the dark.

What comes next—and how to stay in formation

Method without movement is a PDF nobody uses. Movement without method is a mob with a megaphone. We are building both: open instruments for peer-relative value, and a network of roles—data gatherers, benchmarking intelligence creators, website hosts, promoters, meeting advocates, media partners—who can stand up local scoreboards when the kits are ready.

In the next pieces in this series, we will walk a single jurisdiction end-to-end as a chapter-lead story, then open the downloadable suite: data gathering, careful AI-assisted processing under human guardrails, and public benchmarking sites neighbors can actually use.

Between method and toolkit, stay on the bus.

If this article sharpened your sense of how fair comparison should work, subscribe to Human-Centered Change & Innovation Weekly. That list is how you get first notice when the guidebooks and DIY tools move from spark to usable firepower—practical next steps for the jurisdiction and role you choose.

Prefer the full signup page? Open the newsletter signup page.

Forward this to the person who already knows the peer set in their head—and to the person who keeps saying the comparison “isn’t fair” without ever defining fair. Fairness is designable. That is the work.

Absolute spend is a slogan. Peer-relative value is an instrument. Instruments are how human-centered futures get built.

Frequently Asked Questions

What is a Relative Value Score (RVS)?

A Relative Value Score is a peer-normalized measure of outcomes per cost-adjusted dollar for a city, county, state, school district, or special district. It shows how close an entity is to the best performer among similar peers across a small set of transparent metrics—not whether its total budget is large or small in absolute terms.

How do you choose fair peers for comparison?

Fair peers share similar constraints: size and density for cities; mandate mix for counties; enrollment and student-need mix plus regional wages for school districts; service population and infrastructure profile for water and special districts. Publish the cohort rules, keep the set large enough to be meaningful, and allow entities to propose alternate peers with evidence. Unadjusted “leaderboards” that ignore poverty or cost of living are not fair benchmarks.

Should fraud and performance be one score?

No. Keep a performance track (peer-relative value) separate from an integrity overlay (audits, delayed reporting, sole-source patterns, opaque grantee chains) that requires stronger evidence and human review. Combining them into one “corruption score” destroys credibility and unfairly smears underperforming but honest agencies.

Image Credits: Pexels

Content Authenticity Statement: The topic area, key elements to focus on, etc. were decisions made by Braden Kelley, with a little help from Cursor to clean up the article.

Subscribe to Human-Centered Change & Innovation WeeklySign up here to get Human-Centered Change & Innovation Weekly delivered to your inbox every week and to be alerted when the guidebooks and DIY tools to implement this discipline locally are available.

What If You Could Prove the Government is Ripping Us Off?

What If You Could Prove the Government is Ripping Us Off?

by Braden Kelley and Art Inteligencia

We are living through a crisis of civic experience. People can feel that they’re being ripped off by their elected and administrative officials, but yet they lack a fair way to prove it. The future will not be built by louder arguments alone. It will be built by better comparisons: value delivered per dollar, relative to peers who look like us. That is the spark for a human-centered citizen movement. First, let’s look at the scale of the problem already documented in the public record.

The bill without a receipt

Most of us do not experience government as a spreadsheet. We experience it as a journey: the permit that takes months, the school board meeting that buries tradeoffs in jargon, the water bill that climbs while the story never quite lands. That journey is the real product. And if experience design has taught us anything, it is this: when the interface of truth is broken, people do not get smarter by trying harder, they get cynical.

Cynicism is not a character flaw. It is a rational response to incomplete design.

We are asked to fund systems whose performance is rarely presented in the only language that makes human comparison fair: what does a place like mine get for money like mine?

Imagine, just for a moment, learning that a school district with a nearly identical enrollment mix educates children with far less administrative drag and better learning growth per instructional dollar. Or that a peer city issues permits, paves roads, or clears cases at a cost structure that cannot be waved away with “we’re special.” That is not a conspiracy theory. That is a design question. Design questions can be answered, if we stop accepting fog as a management strategy.

Before we build the instruments of peer comparison, we have to stop understating what already leaks, bloats, and under-delivers in plain sight. Innovation begins with facing reality, not romanticizing it.

The scale hiding in plain sight

If this were only a few bad actors and a few delayed audits, a nice annual report and a press release would be enough. The public record says otherwise. What we are looking at is a systems problem: structural error and theft measured in hundreds of billions; spending that sprints past simple population-and-inflation baselines; and institutions whose staffing mix drifts toward administration while the work citizens think they are buying becomes relatively thinner.

Let’s start at the federal level, not because your city council or school board is less important, but because the national numbers are large enough that denial starts looking like a lifestyle choice.

The U.S. Government Accountability Office (GAO) estimated that direct annual financial losses to the federal government from fraud fall between roughly $233 billion and $521 billion a year, based on fiscal years 2018–2022 risk environments (GAO-24-105833 highlights; full report: PDF). That is not a rounding error. That is a second economy of loss living inside the first.

Then there are improper payments – the broader leak that includes overpayments, underpayments, documentation failures, and more. Agencies reported about $236 billion in improper payments in fiscal year 2023 (GAO FY2023 overview) and still about $162 billion in fiscal year 2024 after some pandemic programs wound down (GAO FY2024 press release; GAO-25-107753 PDF). Cumulative improper-payment estimates since fiscal year 2003 approach about $2.8 trillion (see GAO-25-107753). Earlier in the same stretch: roughly $281 billion in FY2021 (GAO) and $247 billion in FY2022 (GAO).

Let’s be clear, as any honest change leader must be: improper payments are not all intentional fraud. But they are the proof that our control experience is broken. If you cannot reliably send the right money to the right place, you do not have a “communications” problem. You have a design problem.
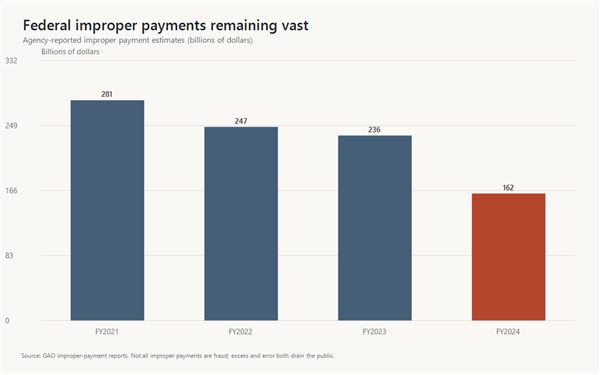
Bar chart of federal improper payment estimates for FY2021 through FY2024, declining from roughly $281 billion to $162 billion but remaining very large.

Federal agency-reported improper payment estimates remain measured in hundreds of billions even after the pandemic peak. Sources:
GAO FY2021 (~$281B);
GAO FY2022 (~$247B);
GAO FY2023 (~$236B);
GAO FY2024 (~$162B).
Scale of loss is one window. Scale of spend is another. Total federal net outlays rose from roughly $3.5 trillion in fiscal year 2014 to roughly $6.7 trillion in fiscal year 2024 – nearly a doubling in a decade in nominal dollars, with the pandemic rewriting the shape of the curve. Those figures come from the U.S. Office of Management and Budget historical outlay series published via the Federal Reserve Bank of St. Louis as FRED series FYONET, with the broader tables at OMB Historical Tables.

More spending can mean more service, more obligations, an older population, emergencies. Futurology without humility is just sci-fi cosplay. But here is the innovation insight most public debates miss: absolute “we spent more” tells citizens almost nothing about unit cost, quality, or leakage. When the size of the system grows, the need for peer-relative instruments grows with it. Otherwise we are asking people to navigate a denser fog with the same broken map.
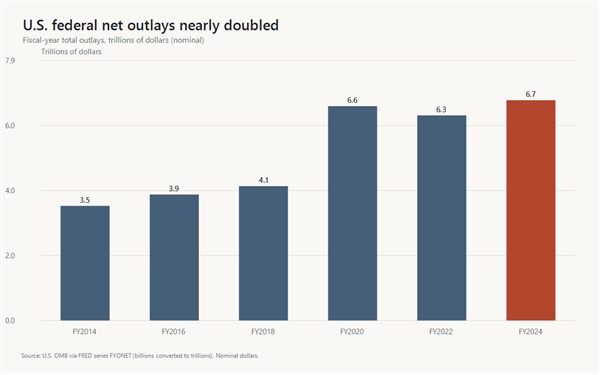
Bar chart showing U.S. federal net outlays rising from about $3.5 trillion in FY2014 to about $6.7 trillion in FY2024.

U.S. federal net outlays, selected fiscal years (nominal dollars). Source:
OMB Federal Net Outlays (FYONET) via FRED.
See also OMB Historical Tables.
Now bring it closer to home – for many of us, literally. Washington State’s Near General Fund–Outlook (NGF-O) operating budget grew from about $31.2 billion in the 2011–13 biennium to about $80.2 billion for 2025–27, roughly a 157% increase in nominal dollars, as laid out by the Washington Policy Center using the state’s NGF-O series. The 2023–25 NGF-O package, after the 2024 supplemental, was about $71.9 billion (Legislative Budget Notes PDF). The same analysis notes that if spending since the mid-2010s had tracked only population and inflation, today’s scale would be tens of billions lower. Growth is real. “We only kept up with costs” is a different claim. Official statewide spending trails also live at fiscal.wa.gov.

This is not a Washington-only story. It is a pattern story: when the bar chart climbs and the experience of value does not climb with it, citizens notice – even if they cannot yet prove the gap against peers.
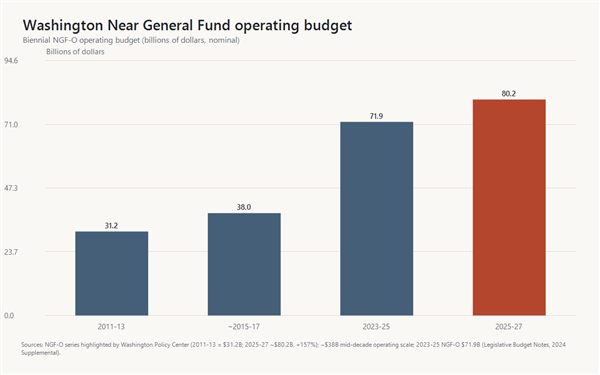
Bar chart of Washington state Near General Fund–Outlook biennial operating budgets rising from $31.2 billion in 2011–13 to about $80.2 billion in 2025–27.

Washington NGF-O biennial operating budget scale (nominal). Sources:
Washington Policy Center NGF-O growth summary
(2011–13 ≈ $31.2B; 2025–27 ≈ $80.2B; ~157%);
2023–25 NGF-O ≈ $71.9B (Legislative Budget Notes PDF);
mid-decade ~$38B scale as described in the same WPC overview of the decade-long climb.
Then there is administrative gravity, especially in higher education, where parents still believe they are buying teaching first. The Delta Cost Project at the American Institutes for Research documented something experience designers would call a quiet interface change: as managerial and professional administrative ranks grew, the average number of faculty and staff per administrator fell by roughly 40 percent at many four-year institutions between 1990 and 2012, landing near 2.5 or fewer faculty and staff per administrator (Desrochers & Kirshstein, Labor Intensive or Labor Expensive?, 2014 (PDF); AIR press summary). Professional non-faculty roles often grew faster than full-time instructional capacity, even as campuses leaned harder on part-time instructors. The underlying institutional data ecosystem lives in IPEDS and the Delta Cost Project database.

Is every new position waste? Of course not. Human organizations need coordination. The revolutionary question is not “abolish administration.” It is: do we have a transparent, peer-relative view of what administration costs relative to learning and outcomes — or are we just hoping for the best?
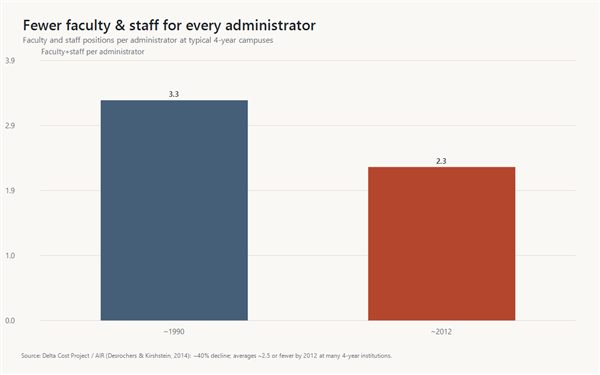
Bar chart showing faculty and staff positions per administrator declining from roughly 3.3 around 1990 to about 2.3 around 2012.

Illustrative faculty-and-staff-per-administrator levels reflecting Delta Cost Project / AIR findings of roughly a 40% decline from 1990 to 2012 at many four-year campuses, averaging about 2.5 or fewer faculty and staff per administrator.
Source: Desrochers & Kirshstein (2014) PDF.
And then there is the softer, stickier problem: corruption perceptions and nonprofit “grift” that thrives in long outcome chains. In occupational-fraud cases studied by the Association of Certified Fraud Examiners (ACFE), government organizations and for-profit firms land around a median loss of about $150,000 per case, while nonprofits still show up in about one in ten cases, with smaller median losses (about $76,000) that can still wreck a thin-margin mission (Occupational Fraud 2024: A Report to the Nations (PDF)).

Here is the human-centered insight: when public dollars pass through contractors and tax-exempt intermediaries, the distance between the taxpayer’s intention and the citizen’s experience often grows. High overhead, related parties, vague deliverables, and glossy stories without unit costs are not always illegal – but they can be a failure of value design. Law can punish fraud. Only better metrics can expose underperformance that still has good branding.

Trust tracks this story. Transparency International’s Corruption Perceptions Index has scored the United States in the mid-60s out of 100 in recent years, with multi-year deterioration flagged by Transparency International U.S. (see their CPI 2025 statement (PDF)). When perceptions fall, governance gets more expensive — because every negotiation becomes theater, and every reform takes more energy to land.

So stack it up without theatrics: hundreds of billions a year in federal fraud-loss risk and improper-payment leakage; state operating budgets that can more than double across a decade and a half; staffing mixes that load coordination relative to the work many people believe they are buying; pass-through chains that hide unit economics. That is enough reason to innovate how citizens see value. It is not a license to smear every public employee. Revolutionary change worth having is precise, not performative.

Sources for the scale claims above

Why shouting about “too much spending” never ends the argument

American public argument too often collapses into two dead ends. One side treats every dollar as proof of compassion. The other treats every dollar as proof of waste. Both can be partially right, and still leave neighbors holding a slogan instead of a shared fact.

Absolute spend is a weak instrument for learning. Larger places spend more. Harder case mixes cost more. Expensive labor markets pay more without automatically proving mismanagement. When numbers ignore context, people fight about identity instead of performance. That is not governance. That is sportswashing for budgets.

Experience design offers a simpler truth: people cannot improve what they cannot sense. If the “interface” of civic truth is either opaque PDFs or cable-news moral theater, the lived journey of taxpayers becomes cynicism – then disengagement – then the quiet permission structure where bloat, under-delivery, and yes, fraud, get more time than they deserve.

The future of healthier institutions will not be won by volume alone. It will be won by better comparisons ordinary people can use without a PhD in public finance. That is human-centered change in one sentence: redesign the sense-making layer, and better action becomes possible.

A better unit of civic truth: value relative to peers

Futurology has a bad habit: it over-promises technology and under-specifies culture. Here is the cultural upgrade that matters first.

Score places the way adults already rank experiences in the rest of life, relative to alternatives that should be similar.

Peer-relative value asks a sharper question than “how much did we spend?” It asks: among entities of roughly the same size and constraints, who delivers more real outcomes per dollar – and who is the best performer we should be learning from?

That shift changes the emotional temperature of accountability. It is harder to dismiss a neighbor when the comparison is another city that looks like yours, another county with a similar mandate set, another school district with a similar student population, another water district with similar infrastructure age. The conversation stops being “are you for or against government?” and starts being “why are we so different from our best peers?”

Relative performance does not erase values. It clarifies delivery. Compassion with weak unit economics is still compassion, and also an unfinished design problem. Efficiency without outcomes is just thrift cosplay. Citizens deserve both: what was intended, and what was delivered, at a cost that survives peer daylight.

This is innovation in the classic sense: not novelty for its own sake, but a better way of creating and measuring value — at the civic layer, where most of life is still lived.

Where fraud, grift, and bloat actually hide

Serious fraud is not always cinematic. More often it is procedural: sole-source patterns that never face real competition; nonprofit pass-throughs that struggle to show outcomes while still collecting public purpose; administrative layers that expand faster than service quality; capital projects whose unit costs and schedule slips never get benchmarked against places that built something comparable; delay as a shield because documents arrive too late to matter.

This is where passion becomes useful, and where discipline becomes non-negotiable. Performance gaps and integrity red flags are not the same thing. Treating every underperforming budget line as a crime story destroys trust the first time a good-faith agency is smeared. Treating every audit as “politics” is how poor design gets tenure.

A mature citizen practice separates the tracks, think of them as three instrument panels on the same dashboard:

  • Performance: outcomes and service quality relative to cost among peers.
  • Structure: administration share, contracting concentration, salary density versus output.
  • Integrity: delayed reporting, audit findings, related-party patterns, outcome-light grantee chains—presented with sources, confidence, and room to reply.

That separation is not gentleness toward corruption. It is how legitimate pressure remains standing when the pushback arrives. Revolutions that last are the ones that can still tell the truth under scrutiny.

The future of accountability is local (and buildable)

National drama can make local work feel small. It is not. Your life is administered by boards, districts, counties, cities, and agencies that set real prices for real services within a few miles of your door. Those are also the levels where a committed group of citizens can still change the information environment in a single budget cycle.

What is newly possible, and this is the innovation hinge, is not “AI as magic.” Magic is for marketing decks. Real innovation is AI as scale applied to the boring, necessary labor of extraction, classification, plain-language briefing, and pattern spotting — always subordinated to transparent methods and primary records. The opportunity is a suite of do-it-yourself tools that a passionate local team can download, stand up, and own: gather public data, process it with clear human oversight, and publish peer benchmarks for the jurisdiction they care about.

Think of it as open experience architecture for citizenship: not a single national score imposed from above, but many local instruments speaking the same comparative language. Cities. Counties. States. School districts. Water boards and special districts. Same idea. Local ownership. Peer daylight.

Movements fail when they ask everyone to wait for a capital-city hero. They gain power when they give capable people a way to begin where they already have skin in the game—and when the path from “I care” to “I can host a public scoreboard” is designed, documented, and downloadable. That is human-centered change: remove friction between intention and action.

From spark to local firepower: what you can actually do

Enthusiasm without a next step is just another scroll. So here is the honest promise of this movement: we are building the instruments — and you choose the jurisdiction, the intensity, and the role that fits your life.

Start with a target you can describe in one sentence. Your school district. Your city budget. Your county contracting. Your state’s administrative stack. Your water or sewer or flood-control district, the special-purpose governments that spend real money while almost nobody is watching. Passion plus a defined entity beats vague anger about “the system” every time.

Then choose a depth of start that matches your week, not your fantasy of free time:

  • Weekend scout: Pull the latest budget, CAFR, or checkbook export. List the top five cost centers. Note what is missing — outcomes, headcount by function, sole-source awards. That alone is civic reconnaissance.
  • Meeting witness: Show up once a month with three peer-comparison questions written in advance. Serious questions change how staff prepare—and how journalists listen.
  • Budget-season cadence: Build a small team and a calendar tied to when appropriations still can move. That is when numbers still have opponents who can feel them.
  • Local scoreboard: When the toolkit ships, stand up a public site — data intake, AI-assisted processing under human guardrails, and peer-relative benchmarks neighbors can share without translating bureaucracy dialect.

You do not need to do everything. You need a first mile. The guidebooks we will publish will walk those miles: how to FOIA without burning out, how to structure a peer cohort fairly, how to avoid turning a performance gap into a defamation trap, how to brief a board in three minutes, how to partner with a local reporter as an ally rather than an ambush.

Lighting a fire does not mean burning institutions down. It means raising the temperature of truth until fog can no longer survive as a management strategy—and giving thousands of local teams the same matchbook.

Pick a role that fits how you show up

From the outside, movements look monolithic. From the inside, they are division of labor — just like every innovation team that ever shipped anything that mattered. You do not have to become a full-stack auditor, web host, and public speaker on the same Tuesday night. Find the work that matches your temperament. Then find one person whose temperament complements yours.

Data gatherers and custodians. You enjoy documents more than microphones. You pull budgets, salary schedules, bid awards, board packets, 990s tied to public grants. You file public-records requests, keep the source folder honest, and leave a trail so nothing depends on a single hero’s laptop. Without clean intake, every downstream score is theater.

Benchmarking intelligence creators. You want the “so what.” You define peer sets carefully, normalize costs, choose outcome metrics that survive scrutiny, and write method notes so a critic can challenge the math without inventing motives. You turn spreadsheets into stories: unit cost of pavement, administrative share of a district, permit latency per FTE, learning growth per instructional dollar — always versus true peers. When the AI processing stack is ready, this role runs it with human judgment still on the wheel.

Website hosts and local product owners. You are willing to stand something up for your community: a place where neighbors can see the score, the sources, the trends, and an invitation to correct errors. You care about reliability and clarity – not turning a civic tool into a partisan meme machine. The downloadable suite is for you: templates, deployment path, content structure—so passion is not blocked by “I don’t know how to ship a site.”

Promoters, translators, and evangelists. You are the bridge. You do not have to invent the model. You make sure it reaches PTAs, rotary clubs, neighborhood groups, faith communities, taxpayer groups, student journalists, and people who will never open a CAFR unprompted. You translate peer-relative value into plain language, share uncomfortable comparisons without contempt, and keep the movement multipartisan enough that the score—not the team jersey—remains the headline.

Meeting advocates and budget-season operators. You take the brief to the microphone. Three questions. One peer chart. A written record. You show up when the appropriation can still move. The action packs we will release are for this role: scripts, FOIA companions, and “why the gap” one-pagers for boards and councils.

Local media partners and explanation designers. You help facts travel. A retired editor, a podcast host, a newsletter writer, a visual explainer—anyone who can turn a transparent ranking into public attention that demands reply rather than rumor. Credible pressure almost always needs a second institution’s megaphone.

Tutors of the top decile. When a peer is crushing your entity on value, someone should study them without ego—procurement habits, staffing ratios, open-data practices, facility utilization, grantee outcomes. Celebrating excellence is not a side quest. It is how reform becomes copyable instead of merely shaming. That is continuous improvement in civic form.

If you have ever left a public meeting thinking, “Someone should document this properly,” there is a role with your name on it. If you can explain a hard idea at a kitchen table, there is a role. If you can keep a folder organized, there is a role. The only non-role is permanent spectator—assuming someone else will finish the counting.

From newsletter spark to the bonfire of tools

The first act of a movement is not a software download. It is a shared refusal: we will no longer treat uncompared spending as a finished explanation of life. We will learn to ask for peer-relative value. We will demand receipts ordinary people can follow. We will treat the best performers as teachers, not enemies.

The second act is capability. That is the work now underway: do-it-yourself tooling for data gathering, careful AI-assisted processing, and public benchmarking intelligence — plus a series of role-based guidebooks so data gatherers, intelligence creators, website hosts, promoters, and budget-season operators are not inventing discipline from scratch in the dark.

Between spark and bonfire, there is a simple way to stay in formation: join the people who want the heads-up when the kits go live, when the next methods article drops, and when the first local teams start publishing peer scores others can fork and improve.

If this article lit something in you, subscribe to Human-Centered Change & Innovation Weekly. Use that signup as your seat on the bus for this movement. When the downloadable tools and guidebooks are ready — beyond the idea, into usable firepower — that is how you will know first, with practical next steps you can take in the jurisdiction you choose.

Prefer the full signup page? Open the newsletter signup page.

Tell a friend who sits through the same meetings and mutters the same unfinished sentence. Forward this to the person who always says, “If someone would just pull the numbers…” Forward it to the person who already pulls numbers but has nowhere trusted to publish them. Movements scale by invitation more than by manifesto.

For now, sit with the question every zip code deserves:

What if your community pays more and gets less than its true peers — and the only reason it continues is that nobody has finished the counting?

If that question lands, you are already part of the movement. Choose a jurisdiction. Choose a role. Get on the list. We will build the matchbooks — toolkits, methods, and guidebooks — so when you are ready to strike, the fire has somewhere local, human, and bright to go.

Frequently Asked Questions

What is “peer-relative value,” and why is it better than arguing about total spending?

Peer-relative value compares what similar governments achieve per dollar — schools with similar student needs, cities of similar size and density, utilities with similar infrastructure ages — rather than treating raw budget size as proof of success or failure. It makes accountability fairer because it adjusts for context, and sharper because it points to real best performers citizens can learn from. In experience-design terms: it gives people a better interface for understanding value.

Does this approach accuse every high-spending community of fraud?

No. Serious, human-centered accountability separates performance gaps (weaker outcomes or higher unit costs than peers) from integrity red flags (audit issues, opaque grantee chains, noncompetitive contracting patterns) that require stronger evidence. Relative benchmarking creates pressure for better results; it is not a substitute for investigation, law, or due process—and it should never be used as a license to smear people who serve in good faith.

How can I get involved before the tools are fully available?

Choose one jurisdiction you care about, start basic public-record reconnaissance, and pick a role that fits how you show up — data gathering, benchmarking intelligence, website hosting, promotion, meeting advocacy, or media partnership. Subscribe to Human-Centered Change & Innovation Weekly at bradenkelley.com/contact-me/newsletter-signup/ so you are first in line when downloadable toolkits and role-based guidebooks are ready to help stand up local peer-benchmarking sites.

Image Credits: Gemini

Content Authenticity Statement: The topic area, key elements to focus on, etc. were decisions made by Braden Kelley, with a little help from Cursor to clean up the article.

Subscribe to Human-Centered Change & Innovation WeeklySign up here to get Human-Centered Change & Innovation Weekly delivered to your inbox every week.

Time to Rethink Pitch Fests and Business Plan Competitions

Time to Rethink Pitch Fests and Business Plan Competitions

GUEST POST from Arlen Meyers

Pitch fests happen almost every week somewhere in the US, They happen in primary schools, high schools, institutions of higher learning , incubators and accelerators. In addition, the spring and the fall are B school business plan competition season, so look for tweets about who won and pictures of those smiling millennial faces holding big cardboard checks.

These competitions serve many purposes, but, fundamentally the objective is 1) to practice your presentation skils, 2) to get feedback, 3) to find money

I have participated on both sides of the check, as both pitcher and catcher (judge) and have always found the format wanting.

Carl Schramm describes the problem:

 If you look at all our older major corporations — U.S. Steel, General Electric, IBM, American Airlines — and then you look at our newer companies like Amazon, Apple, Facebook, Microsoft, none of these companies ever had a business plan before they got started. Empirically, it appears as if you don’t need a business plan.

Second, the business planning process is largely generated as a preview for venture capital. As I show in my book, from empirical studies, much less than 1% of all new startups ever see a venture capitalist. Much less than 1% of all new companies every year have venture backing of any kind. So, I largely view the creation of a business plan as something of a waste of time.

The third problem is that it seems to make starting a business somewhat like a cookbook. If you do this, and then you do this, and then you do this, the cake will come out okay. And that’s really not how it happens.

I think it is time to rethink these events, and, it seems, so do some investors who are moving towards data-driven investing.

EQT Ventures in Europe takes data-driven investing to a new extreme. The 2-year-old VC firm, which is part of private equity group EQT, uses an AI-driven data platform called Motherbrain to help it make investment decisions. The firm’s €566 million fund backs companies at all stages—except seed—with €3 million to €75 million checks. So far, the firm has invested in 22 startups.

Analytics partner and former VP of analytics at Spotify, Henrik Landgren, said Motherbrain could’ve identified Spotify and Uber as unicorns in the companies’ early days. He believes letting software play a key role in crafting one’s portfolio is “the next evolution of VC.”

Conditional on getting to the stage of submitting a business plan, the judges’ scores have almost no predictive power in determining which entrepreneurs will succeed.

1. The whole notion of writing a business plan v a business model canvas has been called into question given the reality that no battle plan survives the first shot. A colleague suggested “Wild Ass Guess” competition as another way to brand them.

2. Pitches should be limited to no more than m5inutes. Who, in this day and age, watches anything for more than 3 minutes before moving to the next You Tube? Like the hangman’s noose, it focuses the mind. Taking it one step further, idea pitches should last no more than 1 minute.

3. The award money has to be spent on the business, not be used to finance a trip to Europe this summer

4. Winners must commit to passing it forward. There should be an expectation that they will contribute money, effort, time , mentorship or other things to future events and applicants

 5. We should publish rates of startups, success rates, exits and the contributions made to the local, regional and national economy

6. We should require that applicants participate in a pre-submission bootcamp to get their presentations ready for prime time in an effort to not waste the time of volunteers who were hesitant to help in the first place. Here are the skills we want participants to practice:

  1. The professionalism of the technical parts and the presentation itself
  2. Was the presentation appropriate for the audience?
  3. Did you talk about the why or the how of your idea and why did you choose to do that?
  4. Did you tell a story and did it have a biginning, a middle and an end with heros and villains?
  5. Could someone with a fifth grade reading level understand it?
  6. Did you props and other media?
  7. Did you end with a strong call to action?
  8. Did you pitch to the heart or the head of your audience
  9. Did this look like your first rodeo or did you practice?
  10. Was your presentation scripted, look like you “winged it” or did you appear more confident and relaxed?

7. Spend most of the time in front of judges “defending their thesis”. They should be required to think on their feet, answering “what ifs” , since that’s what they will have to do the moment they walk out of the award ceremony.

8. Awardees should be required to participate in iTeams to develop and further test and validate their ideas. They should be encourged to resubmit their business ideas in Phase 2 to apply for money to scale their validated models, similar to the SBIR process. Call it the Scalerator Competition.

9. Awardees must agree to submit testimonials, what the Disney Corporation calls Magical Moments, telling their stories not just about success, but how they overcame adversity and failure.

10. Awardees should spend some time in a real startup, perhaps with the sponsors who put up the bucks to help pay for the event, as an experiential learning opportunity

11. The winner take all format leads to churn and discourages further participation by those who are not the winners

12. Judges come with biases they apply to their decisions whether they use instinct or analysis. There are many false negatives (passing on ideas that are eventually successful) and false positives (getting on ultimate failures).Since we don’t really track long term outcomes of these events, we don’t know many there are.

13. Picking one winner or loser is different than picking a number of companies as part of a risk portfolio. Picking winners in a calm market is something first-timers do just as well as old hands, but avoiding losers is where skill and experience matters.

14. Customers are the ultimate arbiters of success or failure. Rewards should go those teams who have demonstrated they have created them.

15. Here’s another way to launch entrepreneurs and their ideas.

Another issue is the lack of consistency, criteria and implicit bias judging business plans. Business plan judging software has made things more consistent, but as long as humans are applying subjective criteria, there will be some variation. For example, here are some do’s and don’ts from one HBS judge.

Business plan competitions , to some, are a waste of time. Instead, maybe we should have Business Model or just idea competitions.

Encouraging students to submit pie in the sky plans that have little or no validity, judging them using vague and unproven methodologies, awarding them money that they don’t even have to spend on their business ideas and cutting them loose afterwards means the biggest winner is the B school building brand equity. For doctors, scientists and engineers, pressing them to write a business plan before using a validation method is like writing a scientific paper and then doing experiments to find the data you used to justify the conclusions.

Can you imagine pitching at a Quantum Business Plan competition?

We need to stop reality TV B school business plan competitions and pitch fest reward structures and get real about business model and idea competitions.

Image Credit: Pexels

Subscribe to Human-Centered Change & Innovation WeeklySign up here to get Human-Centered Change & Innovation Weekly delivered to your inbox every week.

Revenue Leakage

The Customer Experience Failures Silently Draining Your P&L

Revenue Leakage

by Braden Kelley and Art Inteligencia

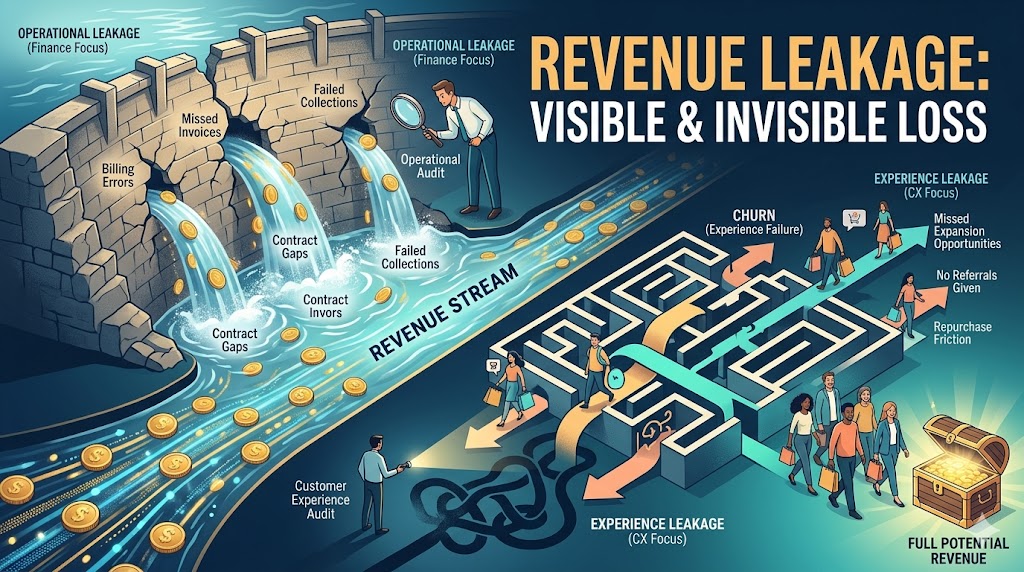
Revenue leakage is one of the most widely discussed topics in finance and operations — and one of the most narrowly defined. Ask most CFOs what revenue leakage means and they will describe billing errors, missed invoices, and contract compliance gaps. These are real problems worth solving. But they represent only the visible surface of a much larger issue.

The revenue leakage that does the most damage to most organizations is not found in the billing system. It is found in the customer experience — in the friction, failed moments, and unmet expectations that cause customers to buy less, expand less, renew less, and advocate less than they would if their experience were better. This form of revenue leakage is invisible in most financial reports. It shows up in churn rates, in Net Promoter Scores, in declining share of wallet, and in the slow erosion of customer lifetime value that compounds quietly over years.

This article addresses both: the operational revenue leakage that finance teams understand, and the experience revenue leakage that most organizations are leaving on the table without realizing it.

What is Revenue Leakage?

Revenue leakage is the gap between the revenue an organization should be capturing and the revenue it actually captures. The standard formula is:

Revenue Leakage % = (Total Potential Revenue − Actual Collected Revenue) ÷ Total Potential Revenue × 100

Industry benchmarks suggest that leakage under 3% is excellent, 3–5% is acceptable, and above 5% requires immediate attention. For a $100M revenue business, 5% leakage represents $5M walking out the door annually — before any consideration of the experience-driven leakage that rarely appears in these calculations at all.

Two Types of Revenue Leakage — and Why Most Organizations Only See One

Type 1: Operational Revenue Leakage

Operational revenue leakage is the form most commonly discussed in finance and RevOps contexts. It includes:

  • Billing errors — incorrect charges, missed charges, duplicate invoices, and pricing discrepancies between what was contracted and what was billed
  • Unbilled services — work performed or value delivered that was never invoiced, often due to disconnected systems between service delivery and billing
  • Contract compliance gaps — discounts that were meant to be temporary becoming permanent, usage overages that were never billed, and renewal terms that weren’t enforced
  • Failed collections — invoices issued but not collected due to expired payment methods, billing contact churn, or inadequate dunning processes
  • Handoff failures — context and commitments lost between sales, implementation, and customer success teams that result in under-delivering against what was sold

This form of leakage is well understood and increasingly addressable through better billing infrastructure, contract management systems, and revenue operations discipline. It is important and worth fixing. It is also, in most organizations, the smaller of the two leakage problems.

Type 2: Experience Revenue Leakage

Experience revenue leakage is the revenue an organization fails to capture — or actively destroys — because of failures in the customer experience. It is the harder-to-see, harder-to-measure, and almost always larger form of revenue leakage. It includes:

  • Churn driven by experience failure — customers who cancel, don’t renew, or stop purchasing because their experience fell below expectations, not because they found a cheaper alternative
  • Expansion revenue never realized — customers who could have bought more, upgraded, or expanded their relationship but didn’t because their experience gave them no reason to
  • Referrals never given — customers who would have recommended you to peers but didn’t because their experience was merely adequate rather than genuinely excellent
  • Repurchase cycles shortened or broken — customers who bought less frequently or in smaller amounts because friction in the experience made doing more business with you feel like more effort than it was worth
  • Price sensitivity artificially elevated — customers who demanded discounts or pushed back on pricing not because your prices were genuinely too high, but because the experience didn’t justify the value you were charging for
  • Recovery costs from poor experiences — the service calls, refunds, make-goods, and relationship repair investments required to address experience failures that should never have occurred

None of these show up cleanly in a billing audit. They are diffuse, difficult to attribute, and invisible in most financial reporting. But their combined scale is enormous. Bain & Company research found that companies that excel at customer experience grow revenues 4–8% above their market — meaning the gap between average and excellent experience represents revenue leakage of that magnitude for every organization that isn’t at the top.

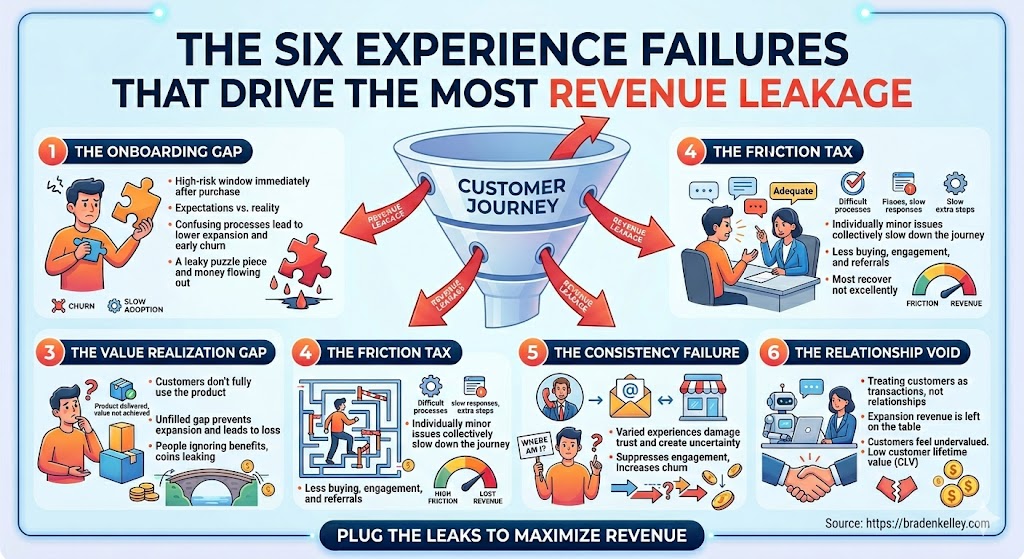
The Six Experience Failures That Drive the Most Revenue Leakage

1. The onboarding gap
The period immediately after purchase is the highest-risk window for experience revenue leakage. Customers arrive with expectations shaped by the sales process and are immediately confronted with the reality of onboarding — which is almost always harder, slower, and more confusing than what they were led to expect. Customers who never fully succeed with onboarding rarely expand, rarely renew enthusiastically, and frequently churn at the first renewal. The revenue lost to poor onboarding is rarely attributed to onboarding — it shows up months later as churn or non-renewal.

2. The service experience valley
Every customer relationship encounters service moments — billing questions, support issues, complaints, and problems that need resolving. These moments are disproportionately important to the overall experience because they are emotionally charged. A service experience handled badly damages trust in a way that no amount of good routine experience can quickly repair. The “service recovery paradox” — where a problem handled exceptionally well can produce higher loyalty than if no problem had occurred — is real, but it requires genuinely excellent recovery, not just adequate resolution. Most organizations deliver adequate. The gap between adequate and excellent is where experience revenue leakage lives.

3. The value realization gap
Customers who don’t fully realize the value they purchased don’t expand their relationship and are easy to lose. Value realization gaps are pervasive — they exist in virtually every B2B and B2C relationship where the product or service requires any customer effort to deliver its benefits. Organizations that actively help customers realize value retain more, expand more, and generate more referrals. Organizations that deliver the product and move on leave the value realization gap unfilled and lose the revenue that would have followed from success.

4. The friction tax
Friction accumulates across the customer journey in ways that are individually minor but collectively significant. Difficult processes, confusing interfaces, slow response times, unnecessary steps, and inconsistent experiences across channels all add to the friction tax customers pay to do business with you. As friction accumulates, customers do less: they buy less often, buy less per transaction, engage less with expansion opportunities, and recommend less enthusiastically. The revenue impact of accumulated friction is diffuse and hard to measure — which is exactly why it persists.

5. The consistency failure
Customers who have excellent experiences in some channels and poor experiences in others trust you less than customers who have consistently good experiences everywhere. Inconsistency is particularly damaging because it creates uncertainty — customers don’t know which version of your organization they are going to encounter. Uncertainty suppresses engagement. Customers who are uncertain about their experience buy less, recommend less, and churn more readily when alternatives present themselves.

6. The relationship void
Organizations that treat customers as transactions rather than relationships systematically leave expansion revenue on the table. Customers who feel known, understood, and valued by their providers spend more, stay longer, and are far more resistant to competitive alternatives. Most organizations are not building relationships — they are processing transactions and calling the result a customer relationship. The revenue gap between transactional and relational customer management is measurable and substantial.

Six Experience Failures That Drive Revenue Leakage

How to Identify Experience Revenue Leakage in Your Organization

Operational revenue leakage can be found through billing audits and contract reviews. Experience revenue leakage requires a different diagnostic approach — one that starts with the customer experience rather than the financial systems.

The most direct method is a customer experience audit — a systematic, human-centered evaluation of how customers actually experience your organization across every channel and touchpoint. An experience audit identifies the specific friction points, service experience failures, value realization gaps, and consistency failures that are driving the revenue leakage your P&L can’t fully explain.

Unlike financial audits that work backwards from revenue data, an experience audit works forward from the customer journey — finding the failures before they fully show up in the numbers. This is critical because experience revenue leakage compounds: a poor onboarding experience in month one doesn’t show up in revenue until month twelve when the renewal doesn’t happen. By the time the financial signal is visible, the customer relationship damage has been accumulating for a year.

Specific diagnostic questions an experience audit answers:

  • Where in the customer journey are the highest-friction moments — the ones customers endure without complaint but that silently reduce their willingness to expand or renew?
  • Which service experience failures are occurring most frequently, and how well are they being recovered from?
  • Are customers actually achieving the outcomes they purchased for, or is there a systematic value realization gap in specific segments or use cases?
  • How consistent is the experience across channels — and where are the inconsistency gaps largest?
  • How does the experience compare to key competitors — and where are you losing on experience quality rather than price?

Quantifying Experience Revenue Leakage

One of the reasons experience revenue leakage persists is that it is difficult to attach a specific number to it. Unlike billing errors, which have a clear dollar value, experience revenue leakage shows up indirectly — in churn rates, expansion rates, NPS scores, and competitive win/loss ratios. But it can be quantified with the right framework.

The Customer Experience Revenue Leakage diagnostic — part of the Experience Audit methodology — maps specific experience failures to their estimated revenue impact across five dimensions: churn contribution, expansion revenue foregone, referral revenue foregone, service recovery cost, and price sensitivity premium. This produces a prioritized estimate of where experience investment will generate the highest financial return — giving CFOs and CX leaders a common language for making the case for experience improvement investment.

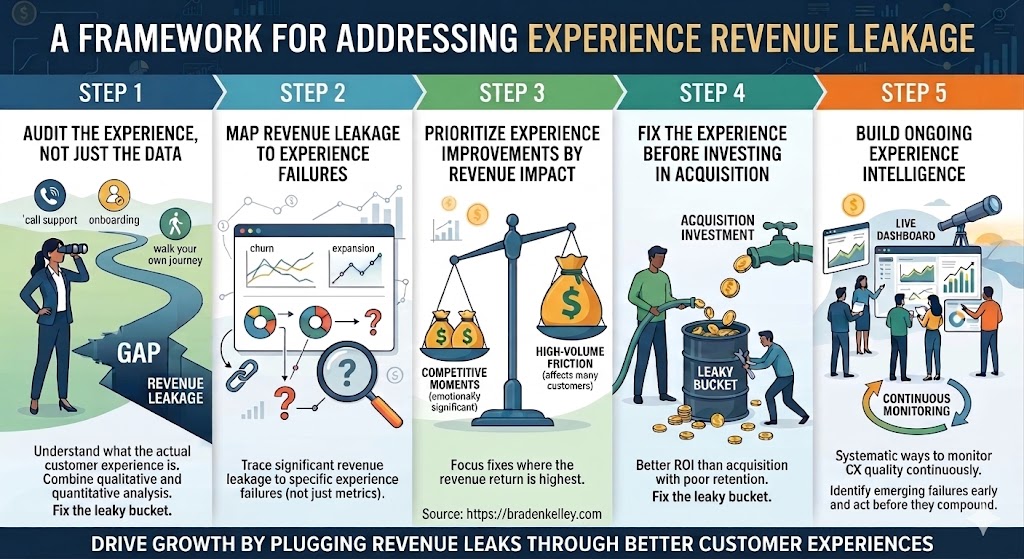
A Framework for Addressing Experience Revenue Leakage

Step 1: Audit the experience, not just the data
Before investing in retention programs, expansion campaigns, or NPS improvement initiatives, understand what the actual customer experience is. Walk your own journey. Call your own support line. Go through your own onboarding as a new customer. The gap between what you think the experience is and what it actually is almost always contains the most important revenue leakage.

Step 2: Map revenue leakage to experience failures, not to revenue metrics
For each significant revenue leakage source — high churn in a specific segment, low expansion in a specific cohort, low NPS in a specific channel — trace it back to the specific experience failures most likely driving it. This requires qualitative research, not just quantitative analysis.

Step 3: Prioritize experience improvements by revenue impact
Not all experience failures drive equal revenue leakage. Prioritize fixes that address high-volume friction (affecting many customers), high-stakes moments (emotionally significant interactions), and competitive gaps (experiences where alternatives are measurably better).

Step 4: Fix the experience before investing in acquisition
The most common and expensive mistake in revenue management is investing heavily in customer acquisition while experience failures are driving significant leakage. Fixing the leaky bucket before pouring more water in consistently delivers better ROI than acquisition investment against a poor retention foundation.

Step 5: Build ongoing experience intelligence
Experience revenue leakage is not a one-time problem to be solved — it is an ongoing management challenge. Organizations that achieve consistently low leakage have built systematic ways to monitor customer experience quality continuously, identify emerging failures early, and act on them before they compound into significant revenue impact.

Framework for Addressing Experience Revenue Leakage

Frequently Asked Questions About Revenue Leakage

What is revenue leakage?

Revenue leakage is the gap between the revenue an organization should be capturing and the revenue it actually captures. It includes both operational leakage — billing errors, unbilled services, contract compliance gaps, and failed collections — and experience leakage — the revenue lost because customer experience failures drive churn, suppress expansion, prevent referrals, and erode price realization. Most definitions of revenue leakage focus exclusively on operational causes, significantly underestimating the total revenue impact. The formula is: Revenue Leakage % = (Total Potential Revenue − Actual Collected Revenue) ÷ Total Potential Revenue × 100.

What causes revenue leakage?

Revenue leakage has two primary categories of causes. Operational causes include billing errors, missed charges, contract compliance failures, failed payment collections, and handoff failures between sales and service teams. Experience causes — which are typically larger in total impact but less visible — include poor onboarding that prevents value realization, service experience failures that damage trust and accelerate churn, friction accumulation across the customer journey that suppresses expansion and repurchase, inconsistent cross-channel experiences that undermine confidence, and transactional rather than relational customer management that leaves expansion revenue uncaptured.

How do you identify revenue leakage?

Operational revenue leakage is identified through billing audits, contract reviews, and revenue operations analysis. Experience revenue leakage requires a different diagnostic approach — specifically, a customer experience audit that walks the actual customer journey to identify the friction points, service failures, value realization gaps, and consistency failures driving churn, suppressing expansion, and eroding customer lifetime value. Financial data can signal that experience revenue leakage exists; only customer experience research can identify where it lives and what is causing it.

What is the difference between revenue leakage and customer churn?

Customer churn is one specific form of revenue leakage — the revenue lost when customers stop doing business with you entirely. Revenue leakage is a broader concept that includes churn but also encompasses revenue lost from customers who stay but buy less, expand less, refer less, and pay less than they would if their experience were better. A customer who renews but never expands their relationship, who would have recommended you but doesn’t, or who accepts your full price reluctantly rather than willingly — all of these represent revenue leakage that doesn’t show up in churn metrics but is nonetheless real and quantifiable.

How does a customer experience audit identify revenue leakage?

A customer experience audit identifies experience revenue leakage by walking the actual customer journey across all channels and touchpoints — finding the specific friction points, service failures, value realization gaps, and consistency failures that are driving revenue loss your financial reports can’t fully explain. Unlike data analysis that works backwards from revenue metrics, an experience audit works forwards from the customer journey (going beyond customer journey mapping), finding failures before they fully compound into financial impact. The result is a prioritized map of experience improvements ranked by their estimated revenue impact — giving leaders a clear, actionable roadmap for fixing the experience failures that are silently draining the P&L.

Ready to find the experience failures driving revenue leakage in your organization? Learn more about the Experience Audit →

Image credits: Google Gemini

Content Authenticity Statement: The topic area, key elements to focus on, etc. were decisions made by Braden Kelley, with a little help from Google Gemini to clean up the article, add images and create infographics.

Subscribe to Human-Centered Change & Innovation WeeklySign up here to get Human-Centered Change & Innovation Weekly delivered to your inbox every week.

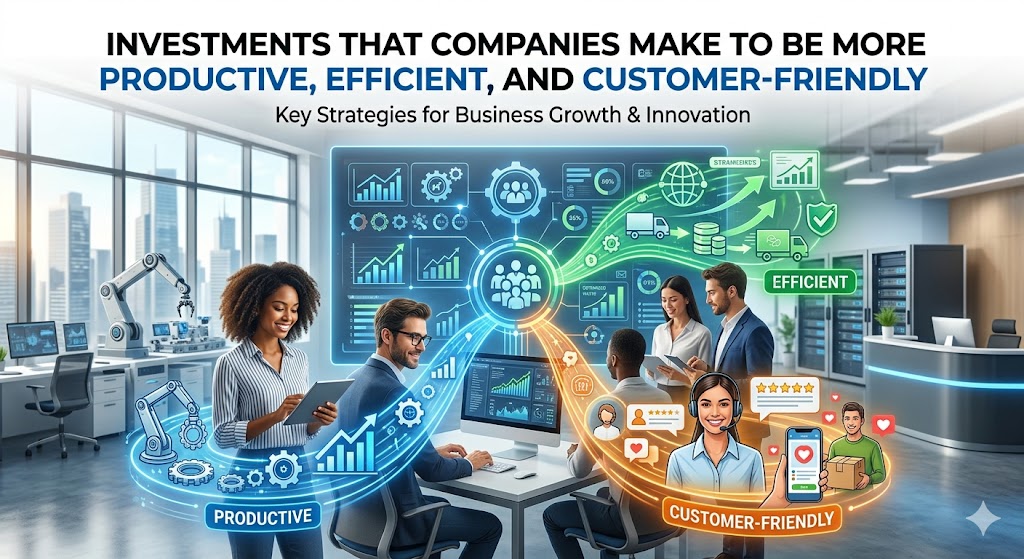
Investments That Make Your Company More Productive, Efficient and Customer-Friendly

Investments That Make Your Company More Productive, Efficient and Customer-Friendly

GUEST POST from Shep Hyken

What company doesn’t want to be more productive, efficient, and customer-friendly? (That’s a rhetorical question.) Isn’t this what every leader wants? Yet recent survey findings from Call Centre Helper an inconsistency in how organizations pursue these goals. This inconsistency can make or break their customer experience strategy. And if they fail their customers, their company may fail, as well.

The Call Centre Helper numbers tell the story. When asked where organizations can get maximum value for money while improving customer experience, a staggering 40% pointed to self-service solutions. Personalization came in a distant second at 18%, followed by productivity tools (12%). And despite years of improvement in AI, chatbots only received 8% of the vote.

In my own 2025 customer service and CX research of over 1,000 U.S. consumers, 68% still prefer the phone as their first choice for customer support, followed by online chat with a live agent at 55%. This creates what I call the customer experience investment paradox, where companies are pushing their investment into self-service tools while customers continue to value human-to-human interactions with live support agents.

The Self-Service Revolution is Real

In spite of the preference for phone support, the digital self-service revolution is real and becoming more important to companies. While the phone is still king, my research found that 34% of customers stopped doing business with a company because self-service options weren’t offered. That’s a third of your potential customers. Even if they prefer the phone, they want the option of doing it themselves.

There are some digital rockstar brands like Amazon and Uber, which have trained customers to expect instant and easy experiences. When customers can order groceries, stream entertainment, or hail a ride with a few taps of their mobile screen, they naturally expect similar experiences with every brand they encounter.

This makes the case for self-service, in spite of the customer’s desire to make a phone call. When the right solution is provided, the benefits to the company are big in the form of reduced operational costs and an improved customer experience. When executed well, self-service allows customers to resolve simple issues instantly, freeing up human agents to take on complex problems that require expertise and empathy.

That said, I regularly caution my clients that going “all in” on self-service without considering the larger customer journey could be a mistake. The keywords to consider are “when executed well.” Poorly implemented self-service creates frustrated customers who eventually demand human assistance anyway, often at a higher cost to resolve, and not to mention the bad will caused by the frustration.

Personalization: A Competitive Differentiator

The 18% investment in improving personalization shows that companies are understanding the importance of creating the personalized experience. My research reveals that 79% of consumers consider a personalized experience to be important.

Consumers are still being bombarded with generic messages from the companies they do business with that often leave them asking, “Why is this company sending this to me?” The result is customers disengage and often move on. As personalization technology improves (dramatically), analytics on a customer’s buying habits, frequency, past products purchased, and more can be incorporated into messaging and customer support experiences that have customers saying, “This company knows me.”

Smart companies use customer data to do more than personalize marketing messages and improve customer support. The data allows companies to anticipate needs, make recommendations for other products and services, and improve the overall customer experience.

The Relevance of the Human Connection

Despite a focus on digital investment, the human-to-human connection cannot be ignored. The fact that 68% of customers still prefer the phone confirms that self-service and chatbots may not be enough. Customers still want to talk to a live human being, especially about complex problems or major complaints.

However, the technology is getting better, and customers are becoming more confident with self-service solutions, which include chatbots. Also, as Gen Zs and younger Millennials become financially secure, they become a major force in the economy. They are the ones becoming I predict the 68% number will go lower for two reasons:

And age makes a difference, or does it? While my research finds that 82% of Baby Boomers prefer the phone, you can’t ignore that 52% of Gen Zs prefer it as well. At the same time, I predict that 68% of customers preferring the phone will go down for at least two reasons. First, the technology is getting better, and customers are becoming more confident with self-service solutions, which include improved chatbots. Second, Gen Zs and younger Millennials, who are more comfortable with technology, are becoming financially secure. The result is that they will be a major force in the economy.

Productivity and Efficiency

The 12% investment into productivity is about efficiency and optimizing the workforce. Some companies believe that being more efficient means replacing the workforce with technology. That’s a dangerous move for reasons and information already shared in this article. However, rather than saving money by eliminating employees, companies can make employees more productive. Imagine technology that saves employees 20% of their workday by eliminating menial tasks or answering basic questions that AI and chatbots can respond to. In turn, they use that time to focus on more important issues and tasks.

Many companies view chatbots as an investment in productivity, however according to the Call Centre Helper findings, companies are investing less than 8% in this powerful tool. My take on this is that companies have been let down by AI-fueled chatbots that make mistakes and hallucinate. That’s yesterday’s chatbot technology. Today, chatbots are far better than they were just a year ago. And if you’re worried about chatbots giving bad information to customers, don’t think that customers haven’t had the same experience with human support.

Final Words

The most successful companies I work with aren’t choosing between digital efficiency and human connection. They’re creating integrated experiences that deliver both. They use self-service for simple, routine interactions while ensuring a seamless hand-off to a human when needed. They leverage personalization to anticipate customers’ needs and build relationships. They invest in tools that enhance rather than replace human connection, achieving what every leader wants: a business that’s more productive, efficient, and loved by its customers.

This article was originally published on Forbes.com.

Image Credit: Gemini

Subscribe to Human-Centered Change & Innovation WeeklySign up here to join 17,000+ leaders getting Human-Centered Change & Innovation Weekly delivered to their inbox every week.

Making Ring-fenced Funding Work

Toughest Challenge Series: Episode 2

Making Ring-fenced Funding Work

GUEST POST from Geoffrey A. Moore


Inspired by the HP Incubations Team

Here’s the challenge. Everyone gets that you need to ring-fence funding for incubating Horizon 3 initiatives. At the corporate level, with the CEO’s direct sponsorship, this can be managed as a separate operating unit with its own budget. The challenge is when the incubation is nested. That means it is being funded out of the operating budget of a Performance Zone business unit, not from some special set-aside allocation.

Nested incubation represents the majority of internally funded Horizon 3 investments. (M&A is a different vehicle, funded out of capex not opex, and is not subject to the challenges we will discuss here). The reason there is a strong preference for nested incubations is that, if successful, they are of immediate interest to the business unit’s current customer base as well as its partner ecosystem. That is, while there can be high technical risk, there is little to no market risk. That said, it is still early days, the technology is not proven, product-market fit still needs to be determined, so it is in no position to generate ROI in the current fiscal year.

The challenge comes to the fore in a tough year where the corporation has to cut back on its operating expenses. Everybody is expected to take a haircut, tighten their belts, suck it up, and carry on. The problem is, when it comes to managing incubations, this simply does not work. Incubation is all about getting and maintaining momentum. If at any point you take your foot off the accelerator, you will lose momentum, and you will never get it back. Instead, you will salvage what you can from the R&D and write the whole thing off to bad timing. But let’s be clear: this is not management, this is mismanagement.

So, what’s the fix? It starts with the business unit surfacing its incubation opportunity during the annual budgeting process. It proposes to set aside a portion of its next year’s budget dedicated to funding the incubation, with funding released on a VC-model based on milestone attainment. This is documented and agreed to at the Executive Leadership Team level. If bad times hit, the choice is never to take a haircut; it is either to carry on or cancel things altogether, and it is made in dialog with the ELT since either way it could have a material impact on the enterprise’s market valuation.

Once the nested incubation has been agreed to, then the business unit leader is responsible for ensuring its funding stays ring-fenced. In particular, this means that resources assigned to the incubation effort cannot be “borrowed” by the current product lines to temporarily address an urgent need. Again, this is all about maintaining momentum.

To ensure this works as planned, here is a tip from a long-time friend and colleague who is the CFO at a major enterprise:

All ring-fenced items are documented and agreed upon at the ELT level. The way it works is the finance team who work with the budget holder is the guardian of all ring-fenced spend. When changes need to be made, they can’t touch ring-fenced spend. Of course, you have to limit the number of ring-fenced items to give freedom of execution to the leaders, but it’s an effective mechanism.

That’s what he thinks. And that’s what I think too. What do you think?

Image Credit: Google Gemini

Subscribe to Human-Centered Change & Innovation WeeklySign up here to join 17,000+ leaders getting Human-Centered Change & Innovation Weekly delivered to their inbox every week.

Concentrated Wealth, Consolidated Markets, and the Collapse of Innovation

Private Equity is Ruining Everything from Sandwiches to Pet Ownership

LAST UPDATED: January 20, 2026 at 3:59 PM

Concentrated Wealth, Consolidated Markets, and the Collapse of Innovation

GUEST POST from Art Inteligencia

I have always maintained that innovation is a byproduct of human curiosity meeting competitive necessity. It is a biological process of sorts; a marketplace needs diversity, mutation, and the survival of the fittest ideas to stay healthy. However, we are currently witnessing a systemic threat to this ecology: the massive concentration of wealth in the hands of a dwindling few. This financial gravity is creating a “Consolidation Gravity Well” that is sucking the life out of industries, raising prices, and — most crucially — killing the very spirit of innovation, community and entrepreneurship.

When wealth is widely distributed, it acts as seed corn for a thousand different experiments. But when wealth is concentrated, it becomes a weapon of market stabilization. For those at the top, innovation is often viewed as a threat to be managed rather than an opportunity to be seized. The result is a rapid consolidation across industries — from digital platforms to healthcare to agriculture — that leaves consumers with fewer choices and higher bills.

“When wealth concentrates, the marketplace loses its heartbeat. We trade the vibrant pulse of human-centered discovery for the sterile, predictable hum of a monopoly’s balance sheet.” — Braden Kelley

The Erosion of Value for Money

The standard economic argument for consolidation is “efficiency.” Larger firms, we are told, can leverage economies of scale to lower costs. Yet, in practice, we see the opposite. When three or four firms control 80% of a market, they stop competing on value creation and start competing on extraction. Without the threat of a nimble competitor stealing their lunch, these giants engage in “shadow pricing” and “feature stripping.”

The consumer feels this as a decrease in value for money. You pay more for a subscription that offers less; you buy food that is more processed but more expensive; you use software that hasn’t seen a meaningful update in five years because there is nowhere else to go. This is a direct consequence of wealth concentration allowing incumbents to buy their way out of the need to innovate.

How Financial Gravity Sucks Wealth Upwards

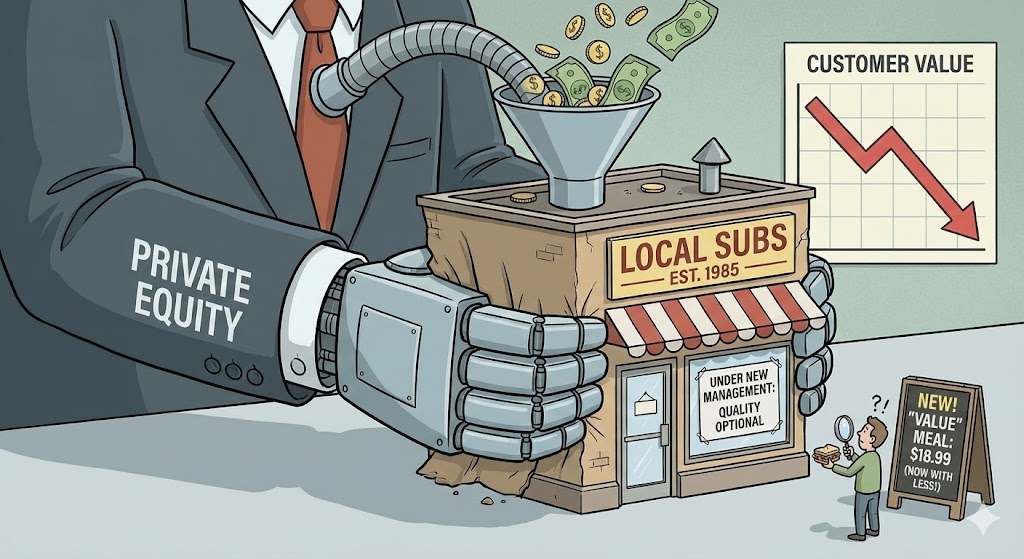
Concentrated wealth creates a financial gravity that funnels massive pools of capital — from sovereign wealth funds and ultra-high-net-worth individuals — directly into private equity (PE) vehicles seeking high-return alternatives to public markets. This capital is deployed through aggressive “roll-up” or “buy-and-build” strategies, where a PE firm identifies a stable “platform” company in a fragmented industry — like plumbing, dental services, HVAC, or veterinary care — and systematically gobbles up smaller independent competitors as “bolt-on” acquisitions. By centralizing control, these firms often shift the focus from organic, empathy-driven innovation to “multiple arbitrage” and operational extraction, where value is manufactured by selling the consolidated giant at a higher valuation multiple than the individual pieces were originally purchased for. The ultimate cost is a landscape where consumer prices often spike by 7% to 20%, competition is silenced, and the marketplace loses the healthy diversity required for genuine, breakthrough human-centered innovation.

Case Study 1: The “Kill Zone” in Digital Platforms

In the technology sector, the concentration of wealth has created what venture capitalists call the “Kill Zone.” This is the space around a dominant platform (like Google, Amazon, or Meta) where any startup that shows true innovative potential is either acquired or crushed. Because these giants have nearly infinite cash reserves, they don’t have to wait to see if a startup’s idea is better. They simply buy the team and the patents, often “sunsetting” the product to protect their existing revenue streams. This has led to a stagnation in social media and search innovation, where the goal for founders is no longer to “build a great company,” but to “get bought by the monopoly.” The human-centered focus on solving user problems is replaced by the financial focus of an exit strategy.

The Innovation Debt of Oligopolies

Consolidated industries suffer from what I call Innovation Debt. Because they face no external pressure to reinvent themselves, they continue to polish old, inefficient systems while ignoring the fundamental shifts in human needs. They become brittle. When a shock hits the system—be it a pandemic or a supply chain crisis—these consolidated giants often fail to adapt because they have spent decades optimizing for profit extraction rather than resilient innovation.

Case Study 2: The Consolidation of American Meatpacking

In the mid-20th century, the meatpacking industry was relatively diverse. Today, just four companies control the vast majority of the market. This concentration of wealth and power has allowed these firms to keep prices high for consumers while keeping payments to farmers low. From an innovation standpoint, the industry has stagnated. Instead of investing in more sustainable, humane, or efficient farming practices, the focus has been on process consolidation and political lobbying to prevent regulation. When the supply chain was tested recently, the lack of innovative, decentralized alternatives led to massive price spikes and shortages. The lack of competition meant there was no “Plan B” being developed by a smaller, hungrier innovator.

Case Study 3: Consumer Goods and Shrinkflation Innovation

In consumer packaged goods, consolidation has produced a different form of innovation failure. Fewer parent companies control hundreds of brands. Price increases are disguised through shrinkflation, packaging changes, and marketing narratives.

Instead of innovating on nutrition, sustainability, or affordability, companies innovate on perception management. Value erodes while margins grow.

This is not innovation in service of humans—it is innovation in service of financial engineering.

Case Study 4: How Private Equity is Redefining the Price of Pet Companionship

For decades, the local veterinarian was a staple of the community—an independent practitioner who knew your dog’s name and your family’s budget. Today, that landscape has been fundamentally reshaped. As of early 2026, private equity firms and megacorporations control approximately 50% of all veterinary clinics in the United States, a staggering leap from just 10% a decade ago. This aggressive “roll-up” strategy is not just changing who signs the paychecks; it is systematically altering the economics of pet ownership, pushing life-saving care and insurance out of reach for many families.

The private equity playbook is simple: acquire independent clinics, centralize administrative functions, and implement standardized, profit-maximizing medical protocols. While proponents argue this brings professional management and better technology, the data suggests a different reality for “pet parents.”

“We are witnessing the financialization of empathy. When a clinic’s primary metric shifts from ‘patient outcome’ to ‘EBITDA multiple,’ the price of a pet’s life becomes a line item that many middle-class families simply can no longer afford.”

Case Study 5: The Industrialized Home

In a world of accelerating change, we often focus on digital transformation, but one of the most significant shifts is happening behind the walls of our homes. The plumbing and HVAC sectors, historically dominated by local family businesses, are currently undergoing a massive private equity roll-up. This financialization is fundamentally decoupling the “service” from the “provider,” leading to an environment where the objective is no longer the longevity of the machine, but the maximization of the average service ticket.

“When a technician is carrying a sales quota instead of a toolbox, the pride of an effective and reasonably priced repair dies. We are trading the resilience of our home infrastructure for the sterile efficiency of a private equity exit strategy.”

Braden Kelley

The “Roll-Up” Reality: Sales over Service

By early 2026, it is estimated that nearly 40% of residential service revenue in major U.S. metropolitan areas is captured by private equity-backed platforms. These firms utilize a “platform and bolt-on” strategy: they buy a large, reputable local company and then acquire smaller competitors to “bolt on” to the operation. While the name on the truck remains the same to preserve generational trust, the internal culture is replaced by high-pressure sales training.

Mini-Case 1: The Wrench Group and the Pricing Surge

The Wrench Group, backed by Leonard Green & Partners, has become a dominant force in the trades. By consolidating major brands like Abacus and Coolray, they have built a multi-billion dollar platform. In many markets where Wrench or similar entities have taken over, homeowners have reported that a standard “capacitor fix” (a $20 part) that used to cost $150 now frequently results in a $15,000 quote for a full system replacement. This shift effectively raises the barrier to home maintenance, making homeownership increasingly unattainable for the middle class as “repairability” is phased out in favor of “replacement cycles.”

Mini-Case 2: TurnPoint Services and the “Membership” Trap

TurnPoint Services, supported by OMERS Private Equity, has rapidly acquired dozens of local plumbing and electrical brands. A core part of their “innovation” is the aggressive push for proprietary membership programs. While marketed as preventative maintenance, these programs are often designed as lead-generation engines. Technicians are trained to find “critical failures” during routine check-ups, using the membership as a hook to keep the homeowner within the corporate ecosystem. This decreases value for money by forcing consumers into a subscription model for services that were historically transactional and transparent.

The Negative Impact on Innovation

This consolidation has a chilling effect on true innovation. Instead of developing more durable HVAC components or more efficient plumbing diagnostics, “innovation” in the sector is now focused on financing algorithms and sales psychology. When the market is controlled by a few giants whose goal is to sell the company in 3 to 5 years, there is no incentive to invest in 20-year solutions. The result is an Innovation Debt that the homeowner pays through premature system failure and inflated insurance premiums driven by the rising cost of emergency repairs.

The Human Cost of Consolidation

From a human-centered perspective, consolidation produces predictable harms:

  • Customers pay more for less value
  • Workers face fewer employers and weaker bargaining power
  • Entrepreneurs encounter higher barriers to entry
  • Society loses resilience and adaptability

Innovation ecosystems require tension. Consolidated systems eliminate it.

Rebuilding Conditions for Real Innovation

Restoring innovation is not about punishing success—it is about restoring balance. Healthy systems reward value creation, not value extraction.

That requires:

  • Modernized antitrust frameworks
  • Capital access beyond elite networks
  • Open, interoperable platforms
  • Human-centered success metrics

Innovation flourishes when power is distributed, competition is real, and human needs—not financial optimization—define progress.

The Path Forward: Human-Centered Systems

If we want to reignite the engine of innovation, we must address the wealth concentration that enables this consolidation. We need policies that protect the “biodiversity” of our markets. Innovation thrives when the barriers to entry are low and the rewards for genuine value creation are high. An innovation speaker like Braden Kelley might tell a boardroom, “Growth is not a zero-sum game of acquisition; it is a generative process of empathy-driven creation.”

We must shift our focus back to the human. When we design markets that prioritize the few, we lose the genius of the many. It is time to climb out of the consolidation gravity well and build an economy that rewards those who dare to build something new, rather than those who simply have the deepest pockets to buy what already exists.

Frequently Asked Questions

How does wealth concentration lead to industry consolidation?

When massive amounts of capital are concentrated in the hands of a few entities or individuals, those players possess the “financial gravity” to acquire competitors, build insurmountable barriers to entry, and buy out emerging startups before they can challenge the status quo.

Why does consolidation decrease innovation?

Innovation requires biological diversity in the marketplace. When an industry consolidates into a duopoly or oligopoly, the remaining players lose the incentive to take risks on breakthrough ideas, shifting instead to rent-seeking.

What is the “Innovation Tax” on consumers?

It is the combination of rising prices and declining value for money that occurs when competition vanishes. Consumers pay more for stagnant products because they have no alternative.

Private Equity Ruins the Sandwich Business

Postscript

Do yourself a favor and avoid private equity owned sandwich chains like Subway, Jimmy John’s, Arby’s, Panera Bread and Jersey Mike’s Subs that have jacked up prices while simultaneously downsizing portions and replacing ingredients with lower quality alternatives. I now routinely go to grocery stores and get a higher quality sandwich at a lower price.

Disclaimer: This article speculates on the potential future direction of society based on current factors. It is hard to predict whether commercial, political and charitable organizations will respond in ways sufficient to alter the course of history or not.

Image credits: Grok, Gemini

Subscribe to Human-Centered Change & Innovation WeeklySign up here to get Human-Centered Change & Innovation Weekly delivered to your inbox every week.
Is OpenAI About to Go Bankrupt?

LAST UPDATED: June 14, 2026 at 4:05 PM

Is OpenAI About to Go Bankrupt?

GUEST POST from Chateau G Pato

The innovation landscape is shifting, and the tremors are strongest in the artificial intelligence (AI) sector. For a moment, OpenAI felt like an impenetrable fortress, the company that cracked the code and opened the floodgates of generative AI to the world. But now, as a thought leader focused on Human-Centered Innovation, I see the classic signs of disruption: a growing competitive field, a relentless cash burn, and a core product advantage that is rapidly eroding. The question of whether OpenAI is on the brink of bankruptcy isn’t just about sensational headlines — it’s about the fundamental sustainability of a business model built on unprecedented scale and staggering cost.

The “Code Red” announcement from OpenAI, ostensibly about maintaining product quality, was a subtle but profound concession. It was an acknowledgment that the days of unchallenged superiority are over. This came as competitors like Google’s Gemini and Anthropic’s Claude are not just keeping pace, but in many key performance metrics, they are reportedly surpassing OpenAI’s flagship models. Performance parity, or even outperformance, is a killer in the technology adoption curve. When the superior tool is also dramatically cheaper, the choice for enterprises and developers — the folks who pay the real money — becomes obvious.

Update — May 2026

Since this article was first published in December 2025, the financial pressures on OpenAI have continued to evolve. The company has pursued additional fundraising rounds and its transition from a nonprofit to a for-profit structure has accelerated — a move widely interpreted as necessary to sustain its capital requirements. Meanwhile competition from Anthropic, Google DeepMind, Meta AI, and a wave of open-source models has intensified, compressing the window in which OpenAI can convert its brand leadership into durable revenue. The core question this article raises — whether OpenAI’s cost structure is sustainable at scale — remains as relevant today as when it was written.

The Inevitable Crunch: Performance and Price

The competitive pressure is coming from two key vectors: performance and cost-efficiency. While the public often focuses on benchmark scores like MMLU or coding abilities — where models like Gemini and Claude are now trading blows or pulling ahead — the real differentiator for business users is price. New models, including the China-based Deepseek, are entering the market with reported capabilities approaching the frontier models but at a fraction of the development and inference cost. Deepseek’s reportedly low development cost highlights that the efficiency of model creation is also improving outside of OpenAI’s immediate sphere.

Crucially, the open-source movement, championed by models like Meta’s Llama family, introduces a zero-cost baseline that fundamentally caps the premium OpenAI can charge. Llama, and the rapidly improving ecosystem around it, means that a good-enough, customizable, and completely free model is always an option for businesses. This open-source competition bypasses the high-cost API revenue model entirely, forcing closed-source providers to offer a quantum leap in utility to justify the expenditure. This dynamic accelerates the commoditization of foundational model technology, turning OpenAI’s once-unique selling proposition into a mere feature.

OpenAI’s models, for all their power, have been famously expensive to run — a cost that gets passed on through their API. The rise of sophisticated, cheaper alternatives — many of which employ highly efficient architectures like Mixture-of-Experts (MoE) — means the competitive edge of sheer scale is being neutralized by engineering breakthroughs in efficiency. If the next step in AI on its way to artificial general intelligence (AGI) is a choice between a 10% performance increase and a 10x cost reduction for 90% of the performance, the market will inevitably choose the latter. This is a structural pricing challenge that erodes one of OpenAI’s core revenue streams: API usage.

The Financial Chasm: Burn Rate vs. Reserves

The financial situation is where the “bankruptcy” narrative gains traction. Developing and running frontier AI models is perhaps the most capital-intensive venture in corporate history. Reports — which are often conflicting and subject to interpretation — paint a picture of a company with an astronomical cash burn rate. Estimates for annual operational and development expenses are in the billions of dollars, resulting in a net loss measured in the billions.

This reality must be contrasted with the position of their main rivals. While OpenAI is heavily reliant on Microsoft’s monumental investment — a complex deal involving cash and Azure cloud compute credits — Microsoft’s exposure is structured as a strategic infrastructure play. The real financial behemoth is Alphabet (Google), which can afford to aggressively subsidize its Gemini division almost indefinitely. Alphabet’s near-monopoly on global search engine advertising generates profits in the tens of billions of dollars every quarter. This virtually limitless reservoir of cash allows Google to cross-subsidize Gemini’s massive research, development, and inference costs, effectively enabling them to engage in a high-stakes price war that smaller, loss-making entities like OpenAI cannot truly win on a level playing field. Alphabet’s strategy is to capture market share first, using the profit engine of search to buy time and scale, a luxury OpenAI simply does not have without a continuous cash injection from a partner.

The question is not whether OpenAI has money now, but whether their revenue growth can finally eclipse their accelerating costs before their massive reserve is depleted. Their long-term financial projections, which foresee profitability and revenues in the hundreds of billions by the end of the decade, require not just growth, but a sustained, near-monopolistic capture of the new AI-driven knowledge economy. That becomes increasingly difficult when competitors are faster, cheaper, and arguably better, and have access to deeper, more sustainable profit engines for cross-subsidization.

The Future Outlook: Change or Consequence

OpenAI’s future is not doomed, but the company must initiate a rapid, human-centered transformation. The current trajectory — relying on unprecedented capital expenditure to maintain a shrinking lead in model performance — is structurally unsustainable in the face of faster, cheaper, and increasingly open-source models like Meta’s Llama. The next frontier isn’t just AGI; it’s AGI at scale, delivered efficiently and affordably.

OpenAI must pivot from a model of monolithic, expensive black-box development to one that prioritizes efficiency, modularity, and a true ecosystem approach. This means a rapid shift to MoE architectures, aggressive cost-cutting in inference, and a clear, compelling value proposition beyond just “we were first.” Human-Centered Innovation principles dictate that a company must listen to the market — and the market is shouting for price, performance, and flexibility. If OpenAI fails to execute this transformation and remains an expensive, marginal performer, its incredible cash reserves will serve only as a countdown timer to a necessary and painful restructuring.

Frequently Asked Questions (FAQ)

  • Is OpenAI currently profitable?
    OpenAI is currently operating at a significant net loss. Its annual cash burn rate, driven by high R&D and inference costs, reportedly exceeds its annual revenue, meaning it relies heavily on its massive cash reserves and the strategic investment from Microsoft to sustain operations.
  • How are Gemini and Claude competing against OpenAI on cost and performance?
    Competitors like Google’s Gemini and Anthropic’s Claude are achieving performance parity or superiority on key benchmarks. Furthermore, they are often cheaper to use (lower inference cost) due to more efficient architectures (like MoE) and the ability of their parent companies (Alphabet and Google) to cross-subsidize their AI divisions with enormous profits from other revenue streams, such as search engine advertising.
  • What was the purpose of OpenAI’s “Code Red” announcement?
    The “Code Red” was an internal or public acknowledgment by OpenAI that its models were facing performance and reliability degradation in the face of intense, high-quality competition from rivals. It signaled a necessary, urgent, company-wide focus on addressing these issues to restore and maintain a technological lead.

UPDATE: Just found on X that HSBC has said that OpenAI is going to have nearly a half trillion in operating losses until 2030, per Financial Times (FT). Here is the chart of their $100 Billion in projected losses in 2029. With the success of Gemini, Claude, Deep Seek, Llama and competitors yet to emerge, the revenue piece may be overstated:

OpenAI estimated 2029 financials

Bring This Thinking to Your Next Event

Braden Kelley is a LinkedIn Top Voice, bestselling author, and innovation keynote speaker who helps organizations get to the future first and build sustainable innovation cultures.

Book Braden as a Keynote Speaker →

Image credits: Google Gemini, Financial Times

Subscribe to Human-Centered Change & Innovation WeeklySign up here to get Human-Centered Change & Innovation Weekly delivered to your inbox every week.

Moving From Disruption to Resilience

Moving From Disruption To Resilience

GUEST POST from Greg Satell

In the 1990s, a newly minted professor at Harvard Business School named Clayton Christensen began studying why good companies fail. What he found was surprising. They weren’t failing because they lost their way, but rather because they were following time-honored principles, such as listening to their customers, investing in R&D and improving their products.

As he researched further he realized that, under certain circumstances, a market becomes over-served, the basis of competition changes and firms become vulnerable to a new type of competitor. In his 1997 book, The Innovator’s Dilemma, he coined the term disruptive technology.

It was an idea whose time had come. The book became a major bestseller and Christensen the world’s top business guru. Yet many began to see disruption as more than a special case, but a mantra; an end in itself rather than a means to an end. Today, we’ve disrupted ourselves into oblivion and we desperately need to make a shift. It’s time to move toward resilience.

The Disruption Gospel

We like to think of ourselves as living in a fast-moving age, but that’s probably more hype than anything else. Before 1920 most households in America lacked electricity and running water. Even the most basic household tasks, like washing or cooking a meal, took hours of backbreaking labor to haul water and cut firewood. Cars were rare and few people traveled more than 10 miles from home.

That would change in the next few decades as household appliances and motorized transportation transformed American life. The development of penicillin in the 1940s would bring about a “Golden Age” of antibiotics and revolutionize medicine. The 1950s brought a Green Revolution that would help expand overseas markets for American goods.

By the 1970s, innovation began to slow. After half a century of accelerated productivity growth, it would enter a long slump. The rise of Japan and stagflation contributed to an atmosphere of malaise. After years of dominance, the American model seemed to have its best days behind it. For the first time in the post-war era, the future was uncertain.

That began to change in the 1980s. A new president, Ronald Reagan, talked of a “shining city on a hill”, and declared that “Government is not the solution to our problem, government is the problem.” A new “Washington Consensus,” took hold that preached fiscal discipline, free trade, privatization and deregulation.

At the same time a management religion took hold, with Jack Welch as its patron saint. No longer would CEO’s weigh the interests of investors with customers, communities, employees and other stakeholders, everything would be optimized for shareholder value. General Electric, and then broader industry, would embark on a program of layoffs, offshoring and financial engineering in order to trim the fat and streamline their organizations.

The End Of History?

There were early signs that we were on the wrong path. Despite the layoffs that hollowed out America’s industrial base and impoverished many of its communities, productivity growth, which had been depressed since the 1970s, didn’t even budge. Poorly thought out deregulation in the banking industry led to a savings and loan crisis and a recession.

At this point, questions should have been raised, but two events in November 1989 would reinforce the prevailing wisdom. First, The fall of the Berlin Wall would end the Cold War and discredit socialism. Then Tim Berners-Lee would create the World Wide Web and usher in a new technological era of networked computing.

With markets opening across the world, American-trained economists at the IMF and the World Bank traveled the globe preaching the market discipline prescribed by the Washington Consensus, often imposing policies that would never be accepted developed markets back home. Fueled by digital technology, productivity growth in the US finally began to pick up in 1996, creating budget surpluses for the first time in decades.

Finally, it appeared that we had hit upon a model that worked. We would no longer leave ourselves to the mercy of bureaucrats at government agencies or executives at large organizations who had gotten fat and sloppy. The combination of market and technological forces would point the way for us.

The calls for deregulation increased, even if it meant increased disruption. Most notably, Glass-Steagall Act, which was designed to limit risk in the financial system, was repealed in 1999. Times were good and we had unbridled capitalism and innovation to thank for it. The Washington Consensus had been proven out, or so it seemed.

The Silicon Valley Doomsday Machine

By the year 2000, the first signs of trouble began to appear. The money rushing into Silicon Valley created a bubble which bursted and took several notable corporations with it. Massive frauds were uncovered at firms like Enron and WorldCom, which also brought down their auditor, Arthur Anderson. Calls for reform led to the Sarbanes-Oxley Act that increased standards for corporate governance.

Yet the Bush Administration concluded that the problem was too little disruption, not too much, and continued to push for less regulation. By 2005, the increase in productivity growth that began in 1996 dissipated as suddenly as it had appeared. Much like in the late 80s, the lack of oversight led to a banking crisis, except this time it wasn’t just regional savings and loans that got caught up, but the major financial center institutions left exposed.

That’s what led to the Great Recession. To stave off disaster, central banks embarked on an extremely stimulative strategy called quantitative easing. This created a superabundance of capital which, with few places to go, ended up sloshing around in Silicon Valley helping to create a new age of “unicorns,” with over 1000 startups valued at more than $1 billion.

Today, we’re seeing the same kind of scandals we saw in the early 2000’s, except the companies being exposed aren’t established firms like Enron, Worldcom and Arthur Anderson, but would-be disrupters like WeWork, Theranos and FTX. Unlike those earlier failures, there has been no reckoning. If anything, tech billionaires like Marc Andreessen and Elon Musk billionaires seem emboldened.

At the same time, there is growing evidence that hyped-up excesses are crowding out otherwise viable businesses in the real economy. When WeWork “disrupted” other workspaces it wasn’t because of any innovation, technological or otherwise, but rather because huge amounts of venture capital allowed it to undercut competitors. Silicon Valley is beginning to look less like an industry paragon and more like a doomsday machine.

Realigning Prosperity With Security

It’s been roughly 25 years since Clayton Christensen inaugurated the disruptive era and what he initially intended to describe as a special case has been implemented as a general rule. Disruption is increasingly self-referential, used as both premise and conclusion, while the status quo is assumed to be inadequate as an a priori principle.

The results, by just about any metric imaginable, have been tragic. Despite all the hype about innovation, productivity growth remains depressed. Two decades of lax antitrust enforcement have undermined competitive markets in the US. We’ve gone through the worst economic crisis since the 1930s and the worst pandemic since the 1910s.

At the same time, social mobility is declining, while anxiety and depression are rising to epidemic levels. Wages have stagnated, while the cost of healthcare and education has soared. Income inequality is at its highest level in 50 years. The average American is worse off, in almost every way, than before the cult of disruption took hold.

It doesn’t have to be this way. We can change course and invest in resilience. There have been positive moves. The infrastructure legislation and the CHIPS legislation both represent huge investments in our future, while the poorly named Inflation Reduction Act represents the largest investment in climate ever. Businesses have begun reevaluating their supply chains.

Yet the most important shift, that of mindset, has yet to come. Not everything needs to be optimized. Not every cost needs to be cut. We cannot embark on changes just for change’s sake. We need to pursue fewer initiatives that achieve greater impact and, when we feel the urge to disrupt, we need to ask, disruption in the service of what?

— Article courtesy of the Digital Tonto blog
— Image credit: Pixabay

Subscribe to Human-Centered Change & Innovation WeeklySign up here to join 17,000+ leaders getting Human-Centered Change & Innovation Weekly delivered to their inbox every week.

Why You Don’t Need An Innovation Portfolio

According to Harvard Business Review

Why You Don't Need An Innovation Portfolio

GUEST POST from Robyn Bolton

You are a savvy manager, so you know that you need an innovation portfolio because (1) a single innovation isn’t enough to generate the magnitude of growth your company needs, and (2) it is the best way to manage inherently risky endeavors and achieve desired returns.

Too bad you’re wrong.

According to an article in the latest issue of HBR, you shouldn’t have an innovation portfolio. You should have an innovation basket.

Once you finish rolling your eyes (goodness knows I did), hear me (and the article’s authors) out because there is a nuanced but important distinction.

Our journey begins with the obvious.

In their article “A New Approach to Strategic Innovation,” authors Haijian Si, Christoph Loch, and Stelios Kavadias argue that portfolio management approaches have become so standardized as to be practically useless, and they propose a new framework for ensuring your innovation activities achieve your strategic goals.

“Companies typically treat their innovation projects as a portfolio: a mix of projects that, collectively, aim to meet their various strategic objectives,” the article begins. “MOO,” I think (household shorthand for Master Of the Obvious).

“When we surveyed 75 companies in China, we discovered that when executives took the trouble to link their project selection to their business’s competitive goals, the contribution of their innovation activities performance increased dramatically,” the authors continue. “Wow, fill this under N for No Sh*t, Sherlock,” responded my internal monologue.

The authors go on to present and explain their new framework, which is interesting in its focus on asking and answering seemingly simple questions (what, who, why, and how) and identifying internal weaknesses and vulnerabilities through a series of iterative and inclusion conversations. The process is a good one but feels more like an augmentation of an existing approach rather than a radically new one.

Then we hit the “portfolio” vs. “basket” moment.

According to the authors, once the management team completes the first step by reaching a consensus on the changes needed to their strategy, they move on to the second step – creating the innovation basket.

The process of categorizing innovation projects is the next step, and it is where our process deviates from established frameworks. We use the word “basket” rather than “portfolio” to denote a company’s collection of innovation projects. In this way, we differentiate the concept from finance and avoid the mistake of treating projects like financial securities, where the goal is usually to maximize returns through diversification. It’s important to remember that innovation projects are creative acts, whereas investment in financial securities is simply the purchase of assets that have already been created.

“Avoid the mistake of treating projects like financial securities” and “remember that innovation projects are creative acts.” Whoa.

Why this is important in a practical sense (and isn’t just academic fun-with-words)

Think about all the advice you’ve read and heard (and that I’ve probably given you) about innovation portfolios – you need a mix of incremental, adjacent, and radical innovations, and, if you’re creating a portfolio from scratch, use the Golden Ratio.

Yes, and this assumes that everything in your innovation portfolio supports your overall strategy, and that the portfolio is reviewed regularly to ensure that the right projects receive the right investments at the right times.

These assumptions are rarely true.

Projects tend to enter the portfolio because a senior executive suggested them or emerged from an innovation event or customer research and feedback. Once in the portfolio, they progress through the funnel until they either launch or are killed because of poor test results or a slashed innovation budget.

They rarely enter the portfolio because they are required to deliver a higher-level strategy, and they rarely exit because they are no longer strategically relevant. Why? Because the innovation projects in your portfolio are “assets that have already been created.”

What this means for you (and why it’s scary)

Swapping “basket” in for “portfolio” isn’t just the choice of a new word to bolster the claim of creating a new approach. It’s a complete reframing of your role as an innovation executive.

You no longer monitor assets that reflect purchases or investments promising yet-to-be-determined payouts. You are actively starting, shifting, and shutting down opportunities based on business strategy and needs. Shifting from a “portfolio” to a basket” turns your role as an executive from someone who monitors performance to someone who actively manages opportunities.

And this should scare you.

Because this makes the challenge of balancing operations and innovation an unavoidable and regular endeavor. Gone are the days of “set it and forget it” innovation management, which often buys innovation teams time to produce results before their resources are noticed and reallocated to core operations.

If you aren’t careful about building and vigorously defending your innovation basket, it will be easy to pluck resources from it and allocate them to the more urgent and “safer” current business needs that also contribute to the strategic changes identified.

Leaving you with an innovation portfolio.

Image Credit: Pixabay

Subscribe to Human-Centered Change & Innovation WeeklySign up here to get Human-Centered Change & Innovation Weekly delivered to your inbox every week.