Category Archives: Customer Experience

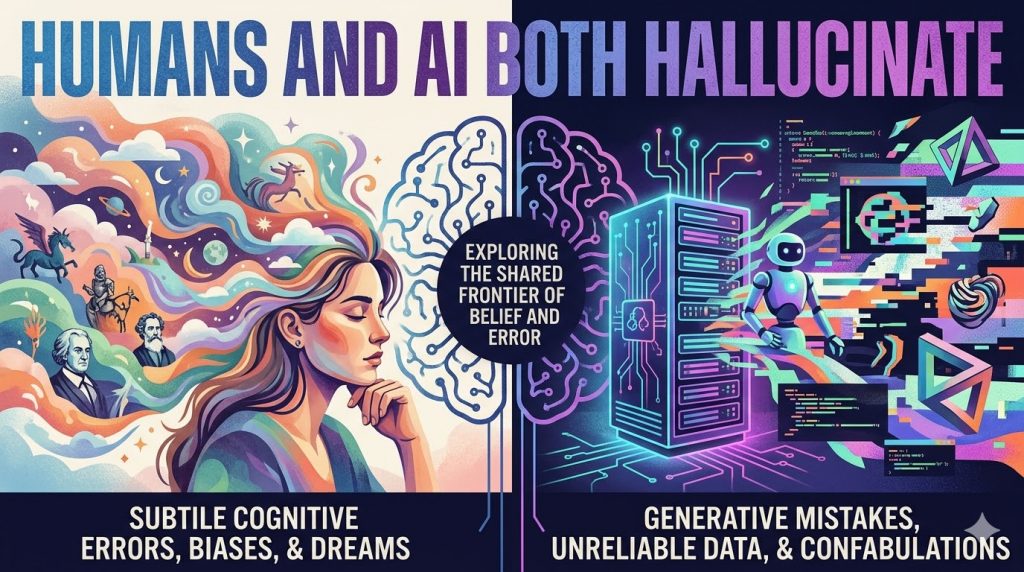
Humans and AI BOTH Hallucinate

Humans and AI BOTH Hallucinate

GUEST POST from Shep Hyken

One of the reasons customers are concerned about or even scared of artificial intelligence (AI) is that it has been known to provide incorrect answers. The result is frustration and concern over whether to believe any AI-fueled technology. In my annual customer service and customer experience research, I asked more than 1,000 U.S. consumers if they ever received wrong or incorrect information from an AI self-service technology. Fifty-one percent said yes.

No, AI is not perfect. Even though the technology continues to improve, it still makes mistakes. And my response to those who claim they won’t trust AI because of those mistakes is to ask, “Has a live customer support agent ever given you bad information?”

That question gets a surprised look, and then a smile, and then an acknowledgement, something like, “You’re right. I never thought about that.”

When AI gives bad information, I refer to that as Artificial Incompetence. It’s just as frustrating when we experience bad information from a live agent, which I call HI, or Human Incompetence. I doubt – I actually know – that the AI and the human aren’t trying to give you bad information.

I once called a customer support number to get help with what seemed like a straightforward question. I didn’t like the answer I received. It just didn’t make sense. Rather than argue, I thanked the agent, hung up, and dialed the same customer support number. A different agent answered, and I asked the same question. This time, I liked the answer. Two humans from the same company answering the same question, but with two completely different answers. And we worry about AI being inconsistent!

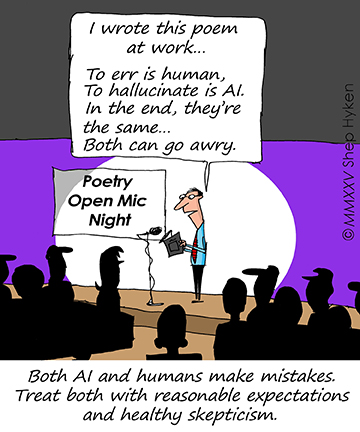
AI Hallucination Cartoon Shep Hyken

AI and Humans Make Mistakes

The reality is that both AI and humans make mistakes, and both will continue to do so. The difference is our expectations. We don’t expect humans to be perfect, so when they are not, we may be disappointed, maybe even angry. We may or may not forgive them, but usually, we just chalk it up to being … human. But it’s different when interacting with AI. We expect it to be reliable, and when it makes a mistake, we often assume the entire system is flawed.

Perhaps we should treat both with the same reasonable expectations and the same healthy skepticism we apply to weather forecasters, who use sophisticated technology and have years of training yet still can’t seem to get tomorrow’s forecast right half the time. Well, it seems like half the time! That doesn’t mean we won’t be checking the forecast before we plan our outdoor activities. AI, too, is sophisticated technology that can make life easier.

Image credits: Gemini, Shep Hyken

Subscribe to Human-Centered Change & Innovation WeeklySign up here to join 17,000+ leaders getting Human-Centered Change & Innovation Weekly delivered to their inbox every week.

Treat Customers Right Without Expecting the Same in Return

The Reality Rule

Treat Customers Right Without Expecting the Same in Return

GUEST POST from Shep Hyken

I recently wrote about the Reality Rule in my Forbes column. Apparently, I hit on a topic that resonated with the Forbes readers, which prompted me to write a version for our subscribers to The Shepard Letter.

The Golden Rule, which most of us learned at a very young age, is to “Do unto others as you would have done unto you.” This is a great business principle when it comes to your customers. Slightly modified, it is “Treat your customers the way you want to be treated.”

My friend Dr. Tony Alessandra adapted the Golden Rule and came up with the Platinum Rule, which is to “Do unto others as they’d like done unto them.” Alessandra’s point is that not everyone wants to be treated the way you do. In business, you must adapt to treating customers according to their needs and expectations, not yours. I’m a believer and proponent of this concept. That said, this article is going to focus on the Golden Rule, but for a different reason.

I was reading a book, Give Hospitality by Taylor Scott, a business allegory about a woman who leaves a job with a toxic culture and finds work with a company that is the exact opposite of what she’d been experiencing. In her second week of training, she sees a sign on the wall:

“Nothing in the Golden Rule says that others will treat us as we have treated them. It only says we must treat others the way we would want to be treated.” -– Rosa Parks, American civil rights activist

This is a powerful quote, especially when you understand the background. The expectation you have of others shouldn’t always be based on how you treat them, and this is especially applicable in the customer experience.

The point is that you will encounter difficult, unreasonable, and downright rude customers. But their behavior should not dictate yours. You have a choice in how you respond.

I’ve seen people on the front line get frustrated when they “bend over backward” for a customer, only to have them continue to be demanding and ungrateful. Expecting them to treat you the same way, with kindness, concern, and empathy, is the wrong expectation. You’re not treating customers well because you expect something in return. You’re doing it because it’s the right thing to do. This is a mindset you must adopt. Otherwise, you risk becoming angry and bitter toward your customers and even your job.

That’s why I’ve come up with a new rule: The Reality Rule, which is to treat customers well, even if they don’t treat you well.

Remember, some customers are having a bad day. Others are just difficult people. Regardless, take a lesson from Give Hospitality and Rosa Parks. Don’t keep score. Focus on what you can control: your attitude, your effort, and your commitment to creating an amazing customer experience that gets customers to say, “I’ll be back!”

Image credits: Gemini

Subscribe to Human-Centered Change & Innovation WeeklySign up here to join 17,000+ leaders getting Human-Centered Change & Innovation Weekly delivered to their inbox every week.

People Love to Repeat Immediate Gratification

People Love to Repeat Immediate Gratification

GUEST POST from Shep Hyken

“Anything that is immediately gratifying will be repeated.” Almost 15 years ago, that was Steve Wynn’s opening line of a keynote speech. Wynn, the founder and chairman of Wynn Resorts, went on to say, “The strongest force on earth is something that affects your self-esteem.”

Wynn was talking about how leaders should treat employees. That is the inspiration for this article. My take on this is simple. When leaders can create a gratifying experience that builds self-esteem for employees, they create fulfillment. In other words, make someone feel good about what they are doing, and they will repeat it and want to keep growing to make it better.

So, how can we create an experience that will be repeated?

Here are four ways:

1. Praise Employees for a Job Well Done: If someone is doing a good job, let them know it. Celebrate their successes and wins. To do this, you must pay attention to what employees are doing.

2. Thank Them for Their Hard Work: It’s one thing to say, “Great job.” It’s another to express genuine appreciation. Thank employees when they step up, work hard, and deliver on your expectations.

3. Educate Employees and Make Them Smarter: Learning is akin to personal growth. Giving people an opportunity to grow will increase their confidence and self-esteem. That growth turns into better employee and customer experiences.

4. Give Them Opportunities to Share Their Stories: This is the big one. In Wynn’s video, he shared the story of an employee who went “above and beyond” to help a hotel guest get their medicine delivered. That became their “North Star” of how employees should treat customers. I recently wrote about these types of stories and how important it is for an organization to not only find them but also share them with their teams. We have a tool I call the Moments of Magic® Card, and it’s the No. 1 culture-changing tool we share with our clients. This ongoing exercise has employees write a short example in just a few sentences about a positive customer or employee experience they created. These are shared at team meetings, and the best get shared throughout the entire company. Some clients compile the examples and assemble a book of their own legendary customer service stories.

Instant Gratification Shep Hyken Cartoon

Share Their Stories

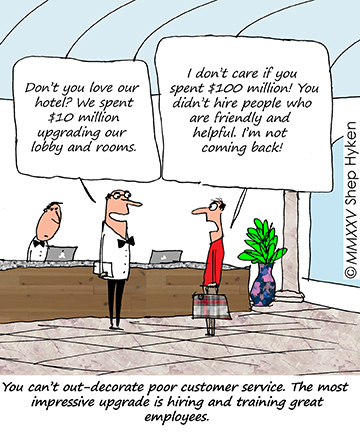
All four of these are important, but let’s emphasize the Share Their Stories idea. Toward the end of his speech, Wynn talked about how he shared the medicine story with all employees. It motivated others to create their stories. He also mentioned that beautiful chandeliers, handwoven fabrics, onyx, and marble are wasted investments if the customers aren’t treated well. Regardless of how beautiful his resorts are, employees make the difference.

Stories from fellow employees create motivation, and it’s gratifying to them to be recognized and praised for their efforts. This is what gets the best behaviors and practices repeated, and what gets customers to say, “I’ll be back.”

Image credits: Pixabay

Subscribe to Human-Centered Change & Innovation WeeklySign up here to join 17,000+ leaders getting Human-Centered Change & Innovation Weekly delivered to their inbox every week.

Mapping Customer Experience Risk to the P&L

The “Invisible Drain”

Mapping Customer Experience Risk to the P&L

LAST UPDATED: May 29, 2026 at 4:54 PM

by Braden Kelley and Art Inteligencia


I. Introduction: The Hidden Cost of Poor Customer Experience (CX)

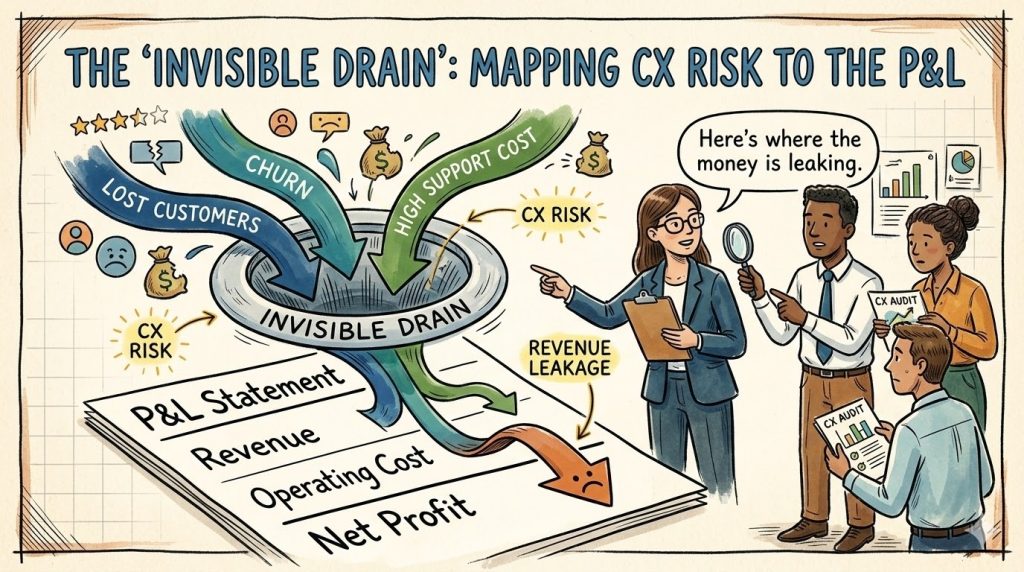
Every organization believes it values its customers. Yet, time and again, businesses lose revenue in ways that are invisible, insidious, and avoidable. This loss is what I call the “Invisible Drain”—the financial leakage caused by friction, frustration, and unmet expectations across the customer journey.

Unlike operational costs that are tracked in spreadsheets or marketing budgets that are accounted for in campaigns, the Invisible Drain does not appear as a line item. It hides in subtle behaviors: customers quietly switching to competitors, abandoning shopping carts, leaving negative reviews, or declining renewal opportunities. Over time, these small losses accumulate into a significant hit to the P&L.

The purpose of this article is to uncover that drain, to show you how to identify where CX failures are costing real money, and to provide practical ways to map those risks directly to the P&L. When organizations understand the financial stakes of every customer touchpoint, they can act decisively—transforming hidden loss into tangible opportunity.

By making the Invisible Drain visible, leaders can move beyond abstract metrics like Net Promoter Score or CSAT and focus on the real outcomes that matter: revenue retention, margin protection, and sustainable growth fueled by exceptional customer experience.

II. Understanding CX Risk

Customer Experience (CX) risk is the potential for negative customer interactions to erode revenue, increase costs, or damage brand reputation. While organizations track operational and financial risks rigorously, CX risk often goes unmeasured, making it invisible until it manifests as lost customers or diminished profits.

CX risk can appear in many forms, including:

  • Churn: Customers leave due to poor experiences or unmet expectations.
  • Service Failures: Delayed support, inconsistent processes, or unresolved complaints that increase operational costs.
  • Lost Opportunities: Friction in the customer journey reduces upsell, cross-sell, or referral potential.
  • Brand Damage: Negative word-of-mouth or social media exposure that indirectly affects revenue and growth.

These risks are often underestimated because the financial impact is not immediately visible on the P&L. CX issues may seem minor in isolation—a delayed delivery, a confusing website flow, or a mismanaged support request—but cumulatively, they drain revenue, reduce margins, and erode long-term customer loyalty.

Understanding CX risk requires looking at the customer journey holistically, identifying points where expectations are not met, and quantifying the potential impact on both revenue and costs. Organizations that take this approach can move from reactive problem-solving to proactive risk management, ultimately protecting both the customer experience and the bottom line.

III. Why CX Risk is “Invisible”

Customer experience risk often remains hidden because traditional business metrics fail to capture its true impact. While organizations monitor sales, costs, and operational efficiency, the subtle erosion of revenue caused by poor experiences rarely shows up in standard financial reports. This invisibility makes CX risk particularly dangerous—it quietly undermines growth before anyone notices.

Several factors contribute to the invisible nature of CX risk:

  • Siloed Departments: Different teams handle sales, support, marketing, and product development independently. CX failures often fall between the cracks, making accountability diffuse.
  • Overreliance on Limited Metrics: Scores like NPS or CSAT provide surface-level insights but don’t fully reveal financial consequences of negative experiences.
  • Short-Term Focus: Quarterly targets and immediate KPIs can overshadow long-term CX considerations, allowing slow leaks to persist unnoticed.
  • Customer Behavior Gaps: Customers rarely voice dissatisfaction for every negative interaction. Silent churn, abandoned carts, and reduced engagement are often invisible until they translate into revenue loss.

Consider a scenario where onboarding friction causes a small percentage of new customers to abandon a subscription within the first three months. Individually, these losses seem minor, but over time they accumulate into a significant financial impact. Without mapping CX touchpoints to P&L, this drain remains unseen—hence the term Invisible Drain.

Making CX risk visible requires connecting experience failures to tangible outcomes, identifying patterns, and translating them into financial terms. Only then can organizations treat CX risk with the same rigor as operational or market risks.

IV. Linking CX to Financial Outcomes

To address the Invisible Drain, organizations must translate customer experience risk into tangible financial terms. CX failures are not just operational issues—they directly impact revenue, costs, and margins. By mapping CX touchpoints to P&L outcomes, companies can quantify the true cost of friction and make data-driven decisions to protect growth.

A practical approach begins by examining each customer interaction along the journey and asking: How could this touchpoint affect revenue, costs, or future opportunities if it fails? Some examples include:

  • Revenue Impact: Delays or confusion during onboarding can reduce customer lifetime value or increase churn.
  • Cost Impact: Frequent support escalations due to unclear processes increase operational expenses.
  • Margin Impact: Lost upsell opportunities or discounts given to appease frustrated customers reduce profitability.

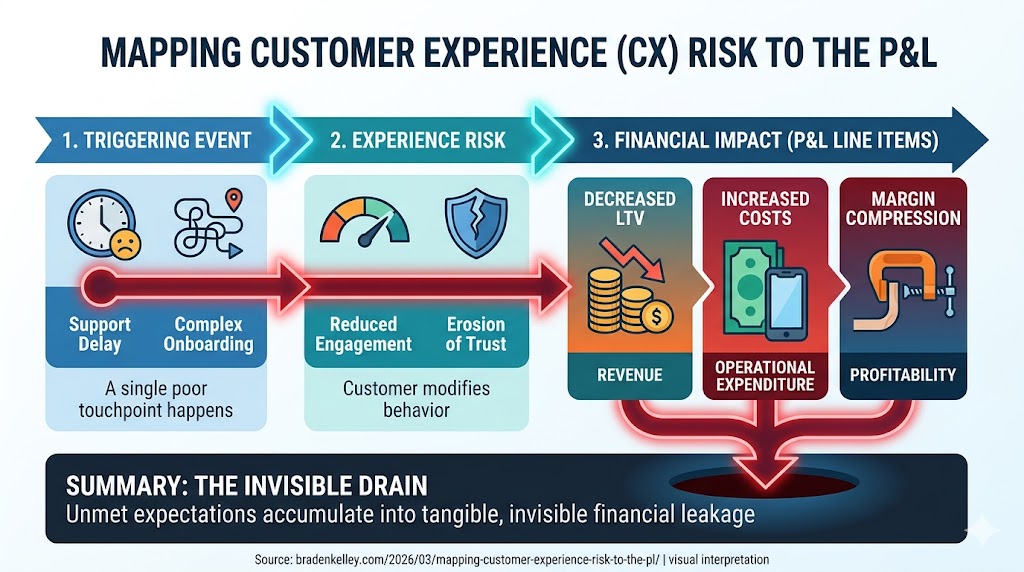
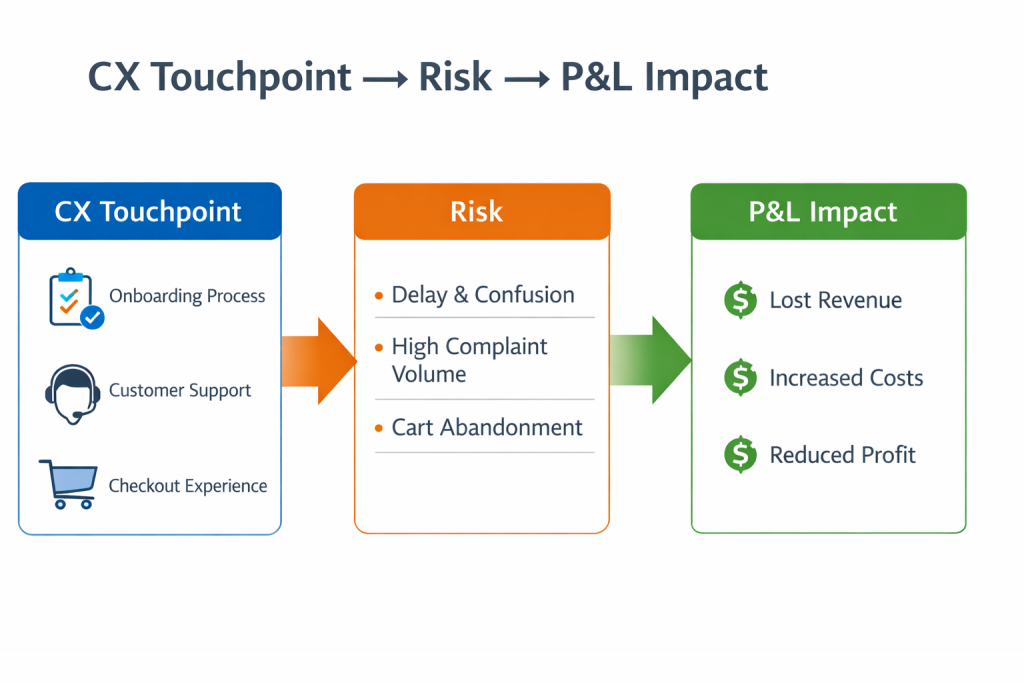
Visualizing the connection helps. Consider a simple framework: CX Touchpoint → Risk → P&L Impact. Each touchpoint carries potential risk; that risk translates into measurable financial outcomes, which then inform prioritization and mitigation strategies.

Quantifying CX risk may involve combining multiple data sources, such as customer surveys, transactional data, operational metrics, and predictive analytics. For example, analyzing churn rates by onboarding experience can reveal the dollar value of friction points. Similarly, tracking complaint resolution times against retention can indicate hidden cost leaks.

By making these connections explicit, executives can see not only where CX risks lie but also how they threaten the bottom line. This clarity enables organizations to invest strategically in improvements, turning customer experience from a perceived cost center into a driver of sustainable revenue and profitability.

V. Identifying High-Risk Areas

Once organizations understand the financial impact of CX risk, the next step is identifying which touchpoints are most vulnerable. Not all interactions carry the same weight—some failures can cost millions, while others have only minor effects. Prioritizing high-risk areas ensures resources are focused where they can deliver the greatest financial and experiential impact.

There are several practical approaches to uncover high-risk CX points:

  • Customer Journey Mapping: Visualize every step in the customer journey to identify friction points, handoff issues, and moments of frustration.
  • Root Cause Analysis of Complaints: Analyze customer complaints and feedback to determine recurring issues and underlying systemic problems.
  • Voice-of-Customer Insights: Leverage surveys, reviews, and social listening to understand where customers experience dissatisfaction or confusion.
  • Predictive Analytics: Use data to identify patterns that indicate future churn or dissatisfaction, enabling proactive intervention before financial impact occurs.

Human-centered design plays a critical role in this process. By observing and empathizing with customers, organizations can uncover risks that quantitative metrics alone might miss, such as emotional frustration, subtle confusion, or unmet expectations that quietly erode loyalty.

The combination of data-driven analysis and human-centered insights provides a comprehensive view of high-risk areas. Once these touchpoints are identified, organizations can take targeted action to mitigate risk, improve the customer experience, and protect the P&L from the Invisible Drain.

VI. Measuring and Prioritizing CX Risk

Identifying high-risk areas is only the first step. To act effectively, organizations must measure the potential financial impact of each risk and prioritize interventions where they will deliver the greatest return. Quantifying CX risk ensures decisions are grounded in evidence rather than intuition.

Several approaches can help measure CX risk in financial terms:

  • Revenue at Risk: Estimate the potential revenue lost due to churn, abandoned purchases, or missed upsell opportunities caused by CX failures.
  • Customer Lifetime Value Erosion: Calculate how friction points reduce the long-term value of customers by shortening retention or decreasing engagement.
  • Cost of Poor Service: Analyze the operational expense incurred from repeated complaints, returns, or service escalations at specific touchpoints.

Once risks are measured, organizations can prioritize them using a simple framework: Impact vs. Likelihood. Touchpoints that have a high financial impact and a high likelihood of failure should be addressed first, while low-impact or unlikely risks may be monitored rather than immediately mitigated.

Combining quantitative data with qualitative insights—such as customer feedback, employee observations, and usability testing—ensures prioritization decisions are accurate and holistic. This approach prevents resources from being wasted on minor issues while focusing efforts on areas that truly protect revenue, margins, and customer loyalty.

Measuring and prioritizing CX risk transforms abstract experience concerns into actionable financial decisions. Organizations gain clarity on where to intervene, creating a roadmap for mitigating risk and safeguarding the P&L from the Invisible Drain.

Mapping CX Risk to the P&L

VII. Connecting CX Risk to the P&L

Measuring and prioritizing CX risk is critical, but the ultimate goal is to translate those insights into financial outcomes that executives and decision-makers can act upon. Connecting CX risk directly to the P&L makes the Invisible Drain visible and creates accountability across the organization.

This connection can be achieved by linking each high-risk touchpoint to specific revenue, cost, and margin impacts:

  • Revenue: Estimate lost sales or reduced renewals caused by friction or poor experiences at key touchpoints.
  • Costs: Quantify additional expenses incurred from repeated service interactions, returns, or complaint management.
  • Margins: Assess the impact of discounts, retention incentives, or lost upsell opportunities driven by CX failures.

Visual frameworks help make these connections clear. A simple but powerful approach is: CX Touchpoint → Risk → P&L Impact. Each touchpoint carries potential risks, which can be quantified and linked to financial outcomes. This framework allows leaders to see not only where the risks exist, but also the tangible dollar value associated with each.

Dashboards and reporting tools can further reinforce this connection. By integrating CX metrics with financial KPIs, organizations can track the real-time impact of experience issues on revenue and costs, creating transparency and urgency. Executives can then allocate resources strategically to mitigate risk and optimize returns.

Cross-functional collaboration is essential. Marketing, operations, product, and customer service teams must work together to understand the financial stakes, address high-risk touchpoints, and implement sustainable improvements. When CX risk is mapped to the P&L, experience management becomes a shared responsibility with clear business outcomes.

VIII. Mitigation Strategies and Innovation Opportunities

Once CX risks are identified, measured, and linked to the P&L, the next step is to act. Mitigation strategies reduce the financial impact of poor experiences, while innovation opportunities turn risk management into a driver of growth.

Practical strategies to mitigate CX risk include:

  • Process Redesign: Simplify and streamline customer journeys to remove friction points and prevent recurring failures.
  • Empowering Employees: Equip frontline staff with tools, authority, and training to resolve issues proactively before they escalate.
  • Digital Tools and Automation: Use technology to improve experience efficiently, such as chatbots for quick support or predictive notifications to prevent errors.
  • Proactive Communication: Anticipate customer needs, set clear expectations, and keep customers informed to reduce uncertainty and dissatisfaction.

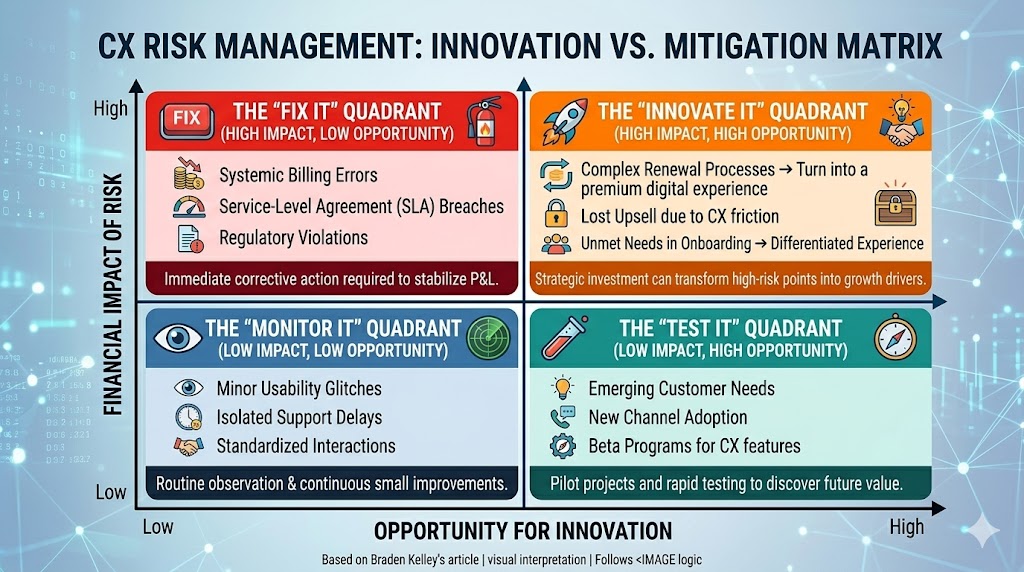
Beyond risk mitigation, high-risk areas often reveal opportunities for innovation. Friction points highlight unmet customer needs, enabling organizations to design new products, services, or experiences that differentiate the brand while generating revenue. For example:

  • Redesigning onboarding processes can create a premium, differentiated experience that boosts retention.
  • Improving support interactions may inspire new self-service tools that reduce costs and increase customer satisfaction.
  • Streamlining e-commerce flows can reduce abandoned carts and increase average order value.

By approaching CX risk with a mindset of both mitigation and opportunity, organizations transform potential drains into strategic assets. Risk management becomes a pathway to innovation, improved loyalty, and measurable impact on the bottom line.

CX Risk Management: Innovation vs. Mitigation Matrix

IX. Governance and Continuous Monitoring

Identifying, measuring, and mitigating CX risk (often using a Customer Experience Audit) is not a one-time effort. Sustained impact requires robust governance structures and continuous monitoring to ensure that improvements are maintained and new risks are detected early.

Effective CX governance includes:

  • Cross-Functional Oversight: Create a CX risk committee or council with representation from marketing, operations, product, and customer service to oversee initiatives and ensure alignment with financial objectives.
  • Defined Roles and Accountability: Assign ownership for each high-risk touchpoint so that responsibilities for monitoring, intervention, and improvement are clear.
  • Integration with Financial Planning: Include CX risk metrics in budgeting and P&L reviews to make experience management a part of routine business decision-making.

Continuous monitoring involves tracking CX performance and its financial implications over time. Tools and approaches include:

  • Dashboards linking CX touchpoint metrics to revenue, costs, and margins.
  • Regular analysis of customer feedback, complaints, and behavior patterns to detect emerging issues.
  • Predictive analytics to anticipate potential risk before it affects the bottom line.
  • Periodic audits of processes, technology, and employee training to ensure consistent experience delivery.

By embedding governance and continuous monitoring into organizational processes, companies create a dynamic system that not only protects against the Invisible Drain but also adapts to evolving customer needs. This disciplined approach ensures that CX improvements are sustainable and that the financial benefits are measurable and enduring.

X. Conclusion: From Invisible Drain to Strategic Asset

The Invisible Drain—hidden financial losses caused by poor customer experience—is real, measurable, and preventable. By understanding CX risk, linking it to the P&L, and prioritizing interventions, organizations can turn what was once a silent drain into a strategic asset.

Mapping CX touchpoints to revenue, costs, and margins brings clarity to the financial stakes of every interaction. It transforms abstract metrics like satisfaction scores into actionable insights that executives can understand and act upon. With the right governance, measurement, and continuous monitoring, organizations can protect their bottom line while delighting customers.

Beyond risk mitigation, this approach uncovers opportunities for innovation. High-risk areas highlight unmet needs and friction points that, when addressed, can differentiate the brand, improve loyalty, and generate sustainable growth. CX risk management thus becomes not just a defensive exercise but a proactive strategy for competitive advantage.

In the end, the organizations that succeed are those that treat customer experience as a financial imperative. By making the Invisible Drain visible, measuring it, and acting decisively, businesses can protect revenue, enhance margins, and transform CX from a potential liability into a powerful driver of value.

Visual Aids and Frameworks

Visualizing the connection between CX risk and financial outcomes helps make the Invisible Drain tangible. These frameworks provide clarity for executives, managers, and frontline teams, turning abstract concepts into actionable insights.

CX Touchpoint → Risk → P&L Impact Framework

A simple way to see the financial impact of CX failures is by mapping each touchpoint through risk to its P&L effect. This framework helps teams prioritize interventions based on measurable financial consequences.

Diagram showing CX Touchpoint leading to Risk and then to P&L Impact

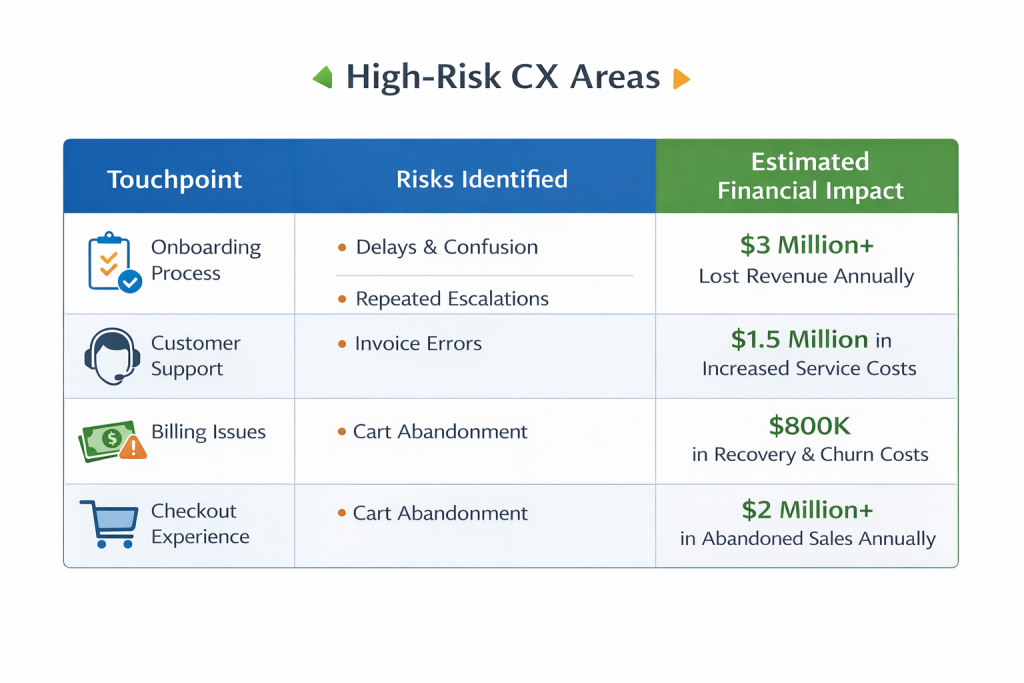
High-Risk CX Areas Table

Identifying the most vulnerable points in the customer journey allows organizations to focus resources effectively. The table below is an example of mapping high-risk areas to estimated financial impact.

“Illustrative estimates based on industry research: Temkin Group (2020), Forrester Research (2018-2021), Gartner (2021).”

Table highlighting high-risk CX areas with estimated financial impact

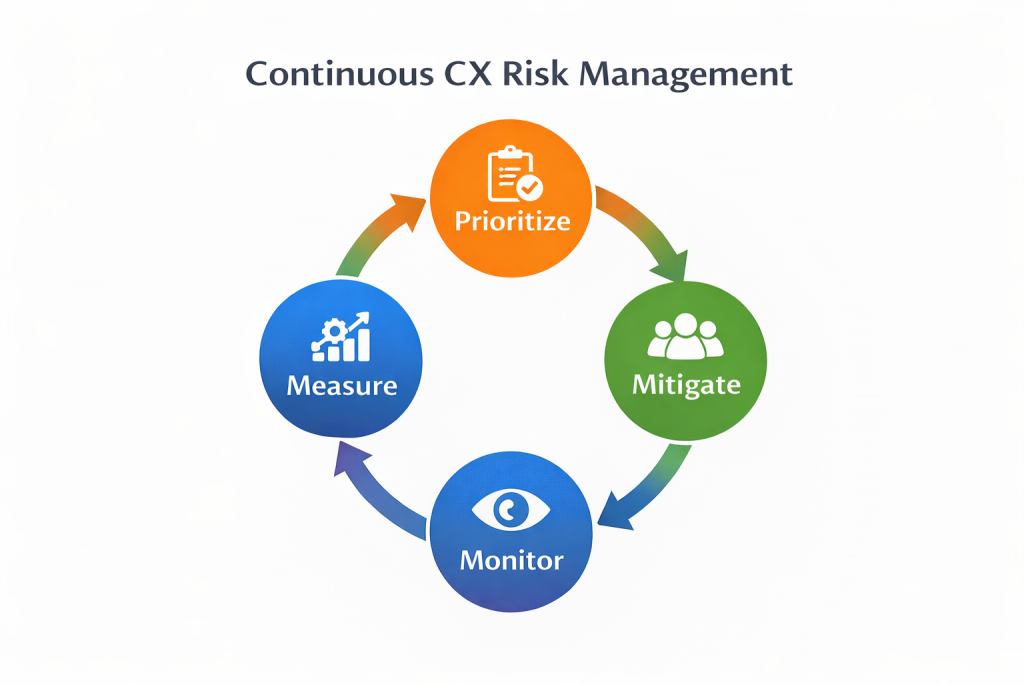
Prioritize → Mitigate → Measure → Monitor Loop

Continuous CX risk management is essential. This cycle ensures risks are addressed, interventions are measured for effectiveness, and monitoring prevents future drains.

Cycle diagram showing Prioritize, Mitigate, Measure, Monitor for CX risk

By integrating these visuals into reports, presentations, and dashboards, organizations can communicate CX risk clearly, justify investments in improvement, and make the Invisible Drain visible to all stakeholders.


Reserve your Customer Experience Risk & Revenue Leakage Diagnostic with Braden Kelley today


Frequently Asked Questions

1. What is the ‘Invisible Drain’ in customer experience?

The ‘Invisible Drain’ refers to the hidden financial losses caused by poor customer experiences that are not immediately visible in traditional business metrics. These losses may appear as silent churn, abandoned sales, or increased operational costs, slowly impacting the P&L.

2. How can organizations link CX risk to the P&L?

Organizations can map each customer touchpoint to potential risks and quantify the associated revenue loss, cost increases, or margin impact. Frameworks like ‘CX Touchpoint → Risk → P&L Impact’ help visualize and measure the financial consequences of poor experiences.

3. What are effective strategies to mitigate high-risk CX areas?

Effective strategies include redesigning processes to reduce friction, empowering employees to resolve issues proactively, leveraging digital tools for efficiency, and continuously monitoring CX metrics. High-risk areas also reveal opportunities for innovation that can enhance revenue and loyalty.


Reserve your Customer Experience Risk & Revenue Leakage Diagnostic with Braden Kelley today


Image credits: ChatGPT, Google Gemini

Content Authenticity Statement: The topic area, key elements to focus on, etc. were decisions made by Braden Kelley, with a little help from ChatGPT to clean up the article and add citations.

Subscribe to Human-Centered Change & Innovation WeeklySign up here to get Human-Centered Change & Innovation Weekly delivered to your inbox every week.

7 Differences Between Interface Design and Experience Design

7 Differences Between Interface Design and Experience Design

by Braden Kelley and Chateau G Pato


What Is the Difference Between Interface Design and Experience Design? (Short Answer)

Seven differences between interface design and experience design: (1) what each designs, (2) the success question, (3) the boundary of the system, (4) how seams and handoffs are treated, (5) how stakes, emotion, and recovery are handled, (6) whether the operating model is in scope, and (7) what “done” and evidence look like. Interface design shapes the surface. Experience design shapes whether a human can finish the job with dignity — before, during, and after the screen. Soft landings fund both. Hard landings ship interface polish and call it UX.

How Should Leaders Define Interface Design vs Experience Design?

Interface design is the craft of controls, layouts, flows, and interaction patterns on a surface — screen, kiosk, voice UI, form — so people can act with clarity and low friction at that surface. Experience design is the craft of the end-to-end lived journey: jobs-to-be-done, emotions, seams, waiting, policy, human help, recovery, and operating-model fit — so people succeed across time and channels, not only inside one UI.

Organizations often hire “UX,” ship polished screens, and call the job done. Interface craft matters. It is not the whole experience. For trust beyond usability heuristics, see 11 Principles for Designing Trust (Not Just Usability). For how service systems manufacture misery even when channels look efficient, see 8 Service Design Mistakes That Create Efficient Misery.

Difference Interface Design Experience Design
Designs Surfaces, controls, interaction patterns End-to-end lived journey
Success question Can they use this UI? Can they finish the job with dignity?
Boundary Edge of the screen/session Before/after, other channels, humans, policy
Seams Often “out of scope” Core design material
Stakes / recovery Error states and microcopy Make-right, trust, powered recovery
Operating model Rarely in the Figma file Incentives, ownership, old path
“Done” / evidence Usability heuristics, task completion Behavior, effort, outcome, return

If the screen is green and the job still fails, you designed an interface — not an experience.

1. What Does Interface Design Design vs Experience Design?

Difference: The object of the craft.

Interface design: Layouts, components, navigation, and interaction patterns on a channel surface.

Experience design: The whole path a human lives — entry, struggle, wait, handoff, outcome, and memory.

Example: A clean checkout UI (interface) vs the journey from “I need this” through delivery anxiety, status silence, and return dignity (experience).

Tell you’re only doing interface work: Shipping a redesign of screens while the journey map still has no owner.

2. How Does the Success Question Differ?

Difference: The primary question the work answers.

Interface design: Can they complete tasks on this surface with low friction?

Experience design: Did they get the job done — functionally and emotionally — as they define success?

Example: High task-completion on “submit claim” (interface) vs claim actually paid without retelling and shame (experience).

Tell: Usability scores celebrated while recontact and quiet exits rise. Usability sits closer to the interface; experience includes trust and outcome dignity — not only whether the button was findable.

3. Where Does the System Boundary End?

Difference: What counts as “in scope.”

Interface design: Ends at the viewport, the app, or the form.

Experience design: Includes what happens before entry, after exit, in email/SMS/phone/store, and with other humans.

Example: A beautiful self-service portal (interface) vs unpaid homework assembling documents before anyone ever logs in (experience).

Tell: “That’s not UX — that’s operations” used to eject the hard parts. For friction that shows up before your map looks tidy, see 12 Friction Points Customers Feel Before Your Journey Map.

4. How Are Seams and Handoffs Treated?

Difference: How broken borders are treated.

Interface design: Handoffs to other teams and systems often become edge cases or dead ends.

Experience design: Seams are where journeys live — designed, owned, and instrumented.

Example: Smooth bot chat (interface) vs bot → agent retelling tax with lost context (experience failure).

Tell: Each channel looks good alone; the customer pays at the border. Those border failures are also where moments that matter more than NPS either earn trust or spend it.

5. How Do Stakes, Emotion, and Recovery Differ?

Difference: How failure and feeling are designed.

Interface design: Validation errors, empty states, microcopy, maybe a “contact us” link.

Experience design: Stakes matched to friction; recovery as a product; dignity when it breaks.

Example: Friendly 404 and undo on a form (interface) vs powered refund or rebook with a human who can finish (experience).

Tell: Apology UI without recovery power.

6. Is the Operating Model In Scope?

Difference: Whether work, policy, and power are design materials.

Interface design: Often assumes the process and incentives are fixed; UI wraps them.

Experience design: Redesigns jobs, decision rights, fine print, and old paths when they block human success.

Example: A sleek approval screen (interface) vs an exception that still needs three supervisors and punishes care (experience still broken).

Tell: “We redesigned the UI” while policy and metrics still manufacture misery. Framing questions that beat a requirements dump help here — see 10 Design Questions That Beat a Requirements Document.

7. What Does “Done” and Evidence Look Like?

Difference: The finish line and proof.

Interface design: Design-system consistency, heuristic review, moderated usability for key tasks.

Experience design: Adopted behavior, effort down, seams owned, recovery used, outcomes that hold — evidence from the lived journey.

Example: Stakeholders love the prototype (interface theater) vs median user time-to-confidence and job completion move in production (experience).

Tell: Demo applause as the definition of done.

How Do You Run a Design-Scope Check Before the Next Release?

Before the next release, ask five questions: Are we designing a surface or a journey? Where does the job actually start and end? Which seam has an owner? What happens when it fails — with what power? What evidence would prove experience success — not only interface usability?

Polish the interface. Design the experience. Don’t confuse the two on the roadmap.

FAQ: Interface Design vs Experience Design

What is the difference between interface design and experience design?

Interface design crafts the surface — controls, layouts, and interaction patterns so people can act clearly on a screen or channel. Experience design crafts the end-to-end lived journey — including seams, waiting, policy, human help, and recovery — so people finish the job with dignity across time and channels.

Is UX the same as UI?

No. UI (user interface) design is closer to interface craft on a surface. UX (user experience) ideally means experience design across the journey — but many organizations use “UX” to mean UI polish. Soft landings insist on naming the difference so polish is not mistaken for success.

Is interface design part of experience design?

Yes. Strong experiences need strong interfaces. Interface design is necessary craft inside experience design — not a substitute for designing seams, policy, recovery, and outcomes beyond the screen.

Why isn’t a good UI enough?

Because the job often fails after the screen — in waiting, handoffs, fine print, unpaid homework, and powerless recovery. A green usability score can coexist with rising recontact, quiet exits, and lost trust when the lived journey was never designed.

How do you measure experience design vs usability?

Usability measures task completion and friction on a surface. Experience design measures whether people finish the job with dignity in context — effort, seam ownership, recovery used, outcomes that hold, and return behavior — not demo applause or heuristic checklists alone.

Image credits: Gemini

Content Authenticity Statement: The topic area, key elements to focus on, etc. were decisions made by Braden Kelley, with a little help from Google Gemini and Cursor to clean up the article, add images and create infographics.

Subscribe to Human-Centered Change & Innovation WeeklySign up here to get Human-Centered Change & Innovation Weekly delivered to your inbox every week.

10 Ways to Prototype Experience Without Building a Product

10 Ways to Prototype Experience Without Building a Product

by Braden Kelley and Art Inteligencia


How Do You Prototype Experience Without Building a Product? (Short Answer)

Ten ways to prototype experience without building a product: (1) concierge delivery, (2) Wizard of Oz, (3) fake-door / offer test, (4) paper or sketch walkthrough, (5) service rehearsal, (6) moment-of-truth enactment, (7) manual-backed facade, (8) pop-up front door, (9) human-scripted conversation, and (10) recovery rehearsal. Soft landings learn the feeling, the job, and the seam before the backlog. Hard landings fund the build and hope the experience shows up later.

Prototype the experience humans will live — not the product you wish you had budget to build.

Why Prototype the Experience Before You Fund the Build?

I keep watching teams schedule a product build to “see if people like it,” polish UI before a behavior hypothesis exists, and treat stakeholder applause at a demo as desirability proof. Those are expensive costumes. Experience prototypes falsify whether people can finish the job with dignity — cheaply.

Cheap evidence sits in the middle between insight and scale — see 6 Stages Most Organizations Skip Between Insight and Scale. Instrument learning with something like The Experiment Canvas™. And do not confuse a clickable demo with learning — prototype-as-finish-line is ceremony in 6 Design Artifacts Worth Keeping — and 6 That Are Ceremony.

Method Falsifies Build can wait until…
1. Concierge Will they hire this job done this way? Demand + behavior proven
2. Wizard of Oz Does the interaction feel trustworthy? Interaction model validated
3. Fake door Will they raise a hand? Interest without theater
4. Paper walkthrough Where does the job break? Flow risks known
5. Service rehearsal Do seams and roles work? Operating model sketched
6. Enactment What does success feel like? Emotional job clear
7. Manual facade Can ops sustain the promise? Promise vs capacity
8. Pop-up Does the channel work in context? Front-door design proven
9. Scripted conversation Does dialogue resolve the job? Conversation design ready
10. Recovery rehearsal Can we make it right when it fails? Trust path designed

If you haven’t felt the experience, you haven’t prototyped it — you’ve only scheduled a build.

1. How Does Concierge Delivery Prototype Experience?

Method: Deliver the end-to-end experience manually for a small set of humans — humans are the system.

Falsifies: Desirability and job fit — will they hire this outcome done this way?

Run lean: Cap at N customers or employees; script the promise; log every step and friction.

Kill/continue: They return, refer, or abandon a workaround — or they ghost after one try.

2. What Is Wizard of Oz Experience Prototyping?

Method: Present an “automated” or agentic experience while a human performs the work unseen.

Falsifies: Interaction trust — clarity, control, and competence feel — before you build the agent.

Run lean: Chat, voice, or UI shell; human operator; record where people hesitate or demand a human.

Kill/continue: They complete with confidence — or trap, retell, or escape the channel. For the trust contract when agents later act for real, see 6 Trust Pillars for Agentic Customer Experience.

3. How Do Fake-Door / Offer Tests Work Without Building?

Method: Offer the experience — landing page, button, email, QR, shelf talker — before it exists; measure intent.

Falsifies: Demand signal without building fulfillment.

Run lean: Clear promise; easy signup; honest “not ready yet” follow-up; no dark patterns.

Kill/continue: Qualified interest above threshold — or curiosity theater with zero follow-through. Fake doors that shame people are trust violations, not prototypes.

4. Why Run a Paper or Sketch Walkthrough?

Method: Walk real users through screens, cards, or paper steps that stand in for the product.

Falsifies: Flow risk — where the job breaks, where language fails, where dignity costs spike.

Run lean: Low fidelity on purpose; one job; watch hands and faces; don’t defend the sketch.

Kill/continue: Time-to-first-success improves — or they invent a workaround mid-walkthrough. Better framing questions before you freeze a build live in 10 Design Questions That Beat a 40-Page Requirements Document.

5. What Is a Service Rehearsal Prototype?

Method: Tabletop, then live rehearsal of the service with real role owners — frontline, backstage, partner.

Falsifies: Operating-model risk — orphan seams, unclear ownership, policy collisions.

Run lean: One journey; timers; “who owns this seam?” cards; stop when a seam has no owner.

Kill/continue: Seams named and staffed — or the rehearsal collapses into “IT will figure it out.”

6. How Does Moment-of-Truth Enactment Prototype Feeling?

Method: Role-play or staged enactment of the critical emotional beat — recovery, consent, first win, bad news.

Falsifies: Emotional job and stakes — what success and betrayal feel like.

Run lean: Real customers or employees if possible; otherwise trained proxies plus later validation; debrief feelings, not features.

Kill/continue: People say “I’d trust that” — or the room goes quiet at the dignity cost.

7. What Is a Manual-Backed Facade?

Method: Ship a thin front — form, chat, page — backed by spreadsheet or ops humans, not a platform.

Falsifies: Promise vs capacity — can you keep the experience promise at small scale?

Run lean: Explicit capacity cap; promises you can keep; log unpaid labor and exception types.

Kill/continue: Ops can sustain with dignity — or heroes burn out keeping the costume alive. Before you fund the bigger pilot, use 11 Questions Before Funding Any Innovation Pilot.

8. How Does a Pop-Up Front Door Prototype Channel Fit?

Method: Stand up a temporary physical or digital front door where the job already happens.

Falsifies: Context and channel fit — will they enter here, not only in your preferred portal?

Run lean: Hours or days, not months; observe wrong-door and escape; capture verbatim jobs.

Kill/continue: Traffic converts to completed jobs — or people walk past to the old path.

9. How Do You Prototype Experience With Human-Scripted Conversation?

Method: Run the conversational experience with a human following — and adapting — a script across SMS, chat, voice, or desk.

Falsifies: Dialogue design — can conversation finish the job without loops or shame?

Run lean: One intent; escalation rules; measure completion and “felt heard.”

Kill/continue: Job done in one conversation — or an escalation storm and retelling tax. Prototyping without a named behavior is a classic design-thinking misuse — see 7 Ways Design Thinking Gets Misused.

10. Why Rehearse Recovery Before You Scale?

Method: Deliberately break or simulate failure; rehearse undo, apology, refund, rebook, and human handoff.

Falsifies: Trust under failure — control, care, and accountability when the happy path dies.

Run lean: One failure mode; powered recovery band; time-to-make-right; named accountable human.

Kill/continue: Recovery restores trust — or “the system decided” leaves nobody askable.

What Should You Ask Before the Next Build Request?

Five questions for experience prototyping:

  1. What named behavior are we falsifying?
  2. Which of these ten methods is the cheapest honest test?
  3. What is the kill/continue date?
  4. Who feels the experience — real humans or stakeholders only?
  5. What must we not build until the experience proves out?

Mantra: Prototype the experience. Build the product only when the feeling and the job survive contact with humans.

FAQ: Prototyping Experience Without Building a Product

How do you prototype an experience without a product?

Prototype an experience without a product by delivering the job manually, running Wizard of Oz interactions, testing offers with fake doors, walking paper flows, rehearsing services and recovery, using manual-backed facades, pop-up front doors, and human-scripted conversations — each with a named behavior and a kill/continue date.

What is a concierge MVP for CX?

A concierge MVP for CX is delivering the end-to-end customer or employee experience by hand for a small set of people — humans are the system — so you learn whether they will hire the outcome before you fund a product build.

What is Wizard of Oz prototyping?

Wizard of Oz prototyping presents an automated or agentic experience while a human performs the work behind the curtain — falsifying whether the interaction feels clear, competent, and controllable before you build the real system.

How do you test a service before building software?

Test a service before building software with service rehearsals, pop-up front doors, manual-backed facades, human-scripted conversations, and recovery rehearsals that prove seams, capacity, dialogue, and make-right — not stakeholder applause at a clickable demo.

When should you stop prototyping and build?

Stop prototyping and build when a named behavior is proven or falsified on a decision date, the experience survives contact with real humans, seams and recovery have owners, and further learning requires scale you cannot fake by hand — not when the demo looks fundable.

Image credits: 1 of 1,550+ FREE quotes for your presentations at http://misterinnovation.com

Content Authenticity Statement: The topic area, key elements to focus on, etc. were decisions made by Braden Kelley, with a little help from Google Gemini and Cursor to clean up the article, add images and create infographics.

Subscribe to Human-Centered Change & Innovation WeeklySign up here to get Human-Centered Change & Innovation Weekly delivered to your inbox every week.

Necesita un Diagnóstico de Riesgo de Experiencia del Cliente y Fuga de Ingresos

Por qué está perdiendo más de lo que cree — y ni siquiera lo sabe

ÚLTIMA ACTUALIZACIÓN: 27 de febrero de 2026 a las 6:27 PM (ENGLISH LANGUAGE VERSION)

Navegando los riesgos de la experiencia del cliente y la pérdida de ingresos

por Braden Kelley y Art Inteligencia


I. El costo invisible de la fricción

La mayoría de las organizaciones miden los ingresos. Algunas miden las ganancias. Un número creciente mide la satisfacción del cliente. Pero muy pocas miden el ingreso en riesgo — y casi ninguna mide sistemáticamente la fuga de ingresos impulsada por la experiencia.

La cruda realidad es esta: lo que los clientes experimentan hoy determina lo que las finanzas reportan mañana. La fricción en el trayecto del cliente rara vez aparece de inmediato en un balance general. En cambio, se acumula silenciosamente: en la vacilación, en la duda, en las transacciones abandonadas, en los problemas no resueltos y en la erosión de la confianza.

Cada flujo de incorporación (onboarding) confuso. Cada política que tiene sentido internamente pero frustra externamente. Cada momento en que un cliente tiene que esforzarse más de lo esperado. Estas no son inconveniencias menores. Son micro-retiros del crecimiento futuro.

Cuando la fricción se agrava, se convierte en una fuga invisible:

  • Los clientes compran menos de lo que pretendían.
  • Los clientes retrasan sus decisiones.
  • Los clientes exploran silenciosamente otras alternativas.
  • Los clientes se van sin quejarse.

Debido a que los tableros tradicionales se centran en indicadores retrospectivos, los líderes a menudo pierden las señales de advertencia temprana. Para cuando el abandono (churn) aumenta o los márgenes se comprimen, el daño a la experiencia ya está hecho.

La experiencia del cliente no es una disciplina “blanda”. Es un indicador principal del desempeño financiero. Si no está midiendo la fricción financieramente, la está tolerando culturalmente.

El primer paso hacia el crecimiento sostenible es reconocer una realidad simple pero incómoda: lo que no puede ver ya le está costando dinero.

II. ¿Qué es un Diagnóstico de Riesgo de Experiencia del Cliente y Fuga de Ingresos?

Un Diagnóstico de Riesgo de Experiencia del Cliente y Fuga de Ingresos es una evaluación estructurada y multifuncional diseñada para descubrir dónde su organización está creando fricción involuntariamente, erosionando la confianza y poniendo en riesgo los ingresos futuros.

No es una encuesta de satisfacción. No es un estudio de percepción de marca. Y no es un taller único de mapeo del trayecto del cliente.

Es un instrumento estratégico que conecta la experiencia del cliente directamente con el rendimiento financiero.

En su esencia, el diagnóstico está diseñado para:

  1. Identificar la fricción en todo el trayecto de extremo a extremo del cliente
    Desde el reconocimiento y la incorporación hasta el servicio y la renovación, revela dónde los clientes dudan, luchan o se desconectan.
  2. Cuantificar el impacto financiero de las fallas en la experiencia
    Traduce los momentos de frustración en exposición de ingresos medible, distorsión del costo de servicio y erosión del valor de vida del cliente (LTV).
  3. Priorizar mejoras basadas en el riesgo y el potencial de recuperación
    Permite a la dirección centrarse en intervenciones que reduzcan el riesgo, restauren la confianza y liberen el crecimiento estancado.

A diferencia de las métricas tradicionales de CX que le dicen qué sucedió, este diagnóstico le ayuda a entender por qué sucedió — y cuánto le está costando.

Al integrar datos operativos, retroalimentación de clientes, conocimientos de empleados y modelado financiero, la organización obtiene una visión clara de:

  • Dónde se están filtrando silenciosamente los ingresos
  • Dónde se está debilitando la confianza
  • Dónde la complejidad interna surge como dolor externo
  • Dónde los competidores están ganando ventaja a través de la simplicidad

En resumen, un Diagnóstico de Riesgo de Experiencia del Cliente y Fuga de Ingresos replantea la experiencia del cliente de una aspiración cualitativa a una disciplina medible de gestión de riesgos y desempeño.

III. Por qué fallan las métricas tradicionales

La mayoría de las organizaciones creen que están midiendo la experiencia del cliente de manera efectiva. Realizan un seguimiento del Net Promoter Score (NPS), la satisfacción del cliente (CSAT), las tasas de conversión, las tasas de abandono y el tiempo promedio de atención. Estas métricas son familiares. Están estandarizadas. Se reportan a la dirección con regularidad.

El problema no es que estas métricas estén equivocadas. El problema es que son incompletas — y son, en su mayoría, indicadores retrospectivos.

Le dicen qué sucedió. Rara vez le dicen por qué sucedió. Y casi nunca le dicen lo que le está costando antes de que se refleje en los ingresos.

Las tres limitaciones fundamentales

  1. Miden el sentimiento, no la exposición
    Un cliente puede informar que está “satisfecho” mientras sigue experimentando una fricción que reduce la frecuencia de compra, el tamaño de la cesta o la lealtad a largo plazo.
  2. Están agregadas y diluidas
    Los desgloses a nivel de trayecto a menudo se ocultan dentro de los promedios de toda la empresa. Un solo punto de contacto de alta fricción puede erosionar la confianza incluso si la puntuación general parece estable.
  3. Miran hacia atrás
    Para cuando aumenta el abandono o disminuyen las recomendaciones, el daño a la experiencia ya se ha agravado. La dirección está reaccionando a los síntomas, no previniendo las causas.

Lo más importante es que las métricas tradicionales rara vez conectan las fallas de experiencia directamente con el riesgo financiero. Sin esa conexión, la fricción se normaliza.

La medición moldea el comportamiento. Si no mide la fricción en términos financieros, envía involuntariamente la señal de que es tolerable.

Un Diagnóstico de Riesgo de Experiencia del Cliente y Fuga de Ingresos cambia el enfoque de “¿Cómo estamos puntuando?” a una pregunta mucho más estratégica:

“¿Dónde estamos poniendo en riesgo involuntariamente los ingresos futuros?”

Ese replanteamiento cambia la conversación: de informar sobre resultados a prevenir pérdidas y desbloquear el crecimiento.

IV. Las cuatro fuentes ocultas de fuga de ingresos

Los ingresos rara vez desaparecen de forma dramática. Se erosionan silenciosamente — a través de la fricción, la falta de alineación y las suposiciones no examinadas. La mayoría de las organizaciones no tienen un problema de ingresos. Tienen un problema de fugas.

Un Diagnóstico de Riesgo de Experiencia del Cliente y Fuga de Ingresos expone cuatro fuentes principales de pérdida oculta.

1. Fuga por fricción

La fuga por fricción ocurre cuando los clientes encuentran esfuerzos innecesarios, confusión o retraso a lo largo de su trayecto.

  • Carritos abandonados y solicitudes incompletas
  • Experiencias de incorporación complicadas
  • Interacciones de soporte repetitivas
  • Procesos de precios o renovación opacos

Cada momento de confusión actúa como un micro-impuesto al crecimiento. Individualmente pequeños. Colectivamente significativos.

2. Fuga por confianza

La fuga por confianza es más sutil y más peligrosa. Ocurre cuando las promesas y la entrega se distancian.

  • Mensajes inconsistentes en todos los canales
  • Compromisos de servicio no cumplidos
  • Mala recuperación tras una falla
  • Decisiones de política que priorizan la eficiencia interna sobre la equidad con el cliente

La confianza es la infraestructura invisible del crecimiento sostenible. Cuando se debilita, es posible que los clientes no se quejen; simplemente reducen su compromiso.

3. Fuga por capacidad

La fuga por capacidad se origina dentro de la organización pero se manifiesta externamente. Ocurre cuando los empleados carecen de las herramientas, la autoridad o la alineación necesarias para ofrecer una experiencia fluida.

  • Sistemas de datos aislados (silos)
  • Plataformas tecnológicas desconectadas
  • Incentivos que recompensan las métricas internas por encima de los resultados de los clientes
  • Empleados de primera línea incapaces de resolver problemas sin escalar

La complejidad interna siempre se convierte en fricción externa.

4. Puntos ciegos estratégicos

La fuga estratégica ocurre cuando las decisiones de la dirección sacrifican involuntariamente el crecimiento a largo plazo por la optimización a corto plazo.

  • Recortes de costos que degradan el valor para el cliente
  • Falta de inversión en la orquestación del trayecto del cliente
  • No escuchar los conocimientos de la primera línea y de los extremos de la organización
  • Exceso de confianza en indicadores retrospectivos

Los bordes de la organización son donde el futuro se vuelve visible por primera vez. Si la dirección no mira allí, el riesgo se agrava silenciosamente.

Cuando estas cuatro formas de fuga se cruzan, el impacto financiero se multiplica. El diagnóstico no solo las identifica, sino que las cuantifica, transformando las preocupaciones abstractas de experiencia en prioridades comerciales medibles.

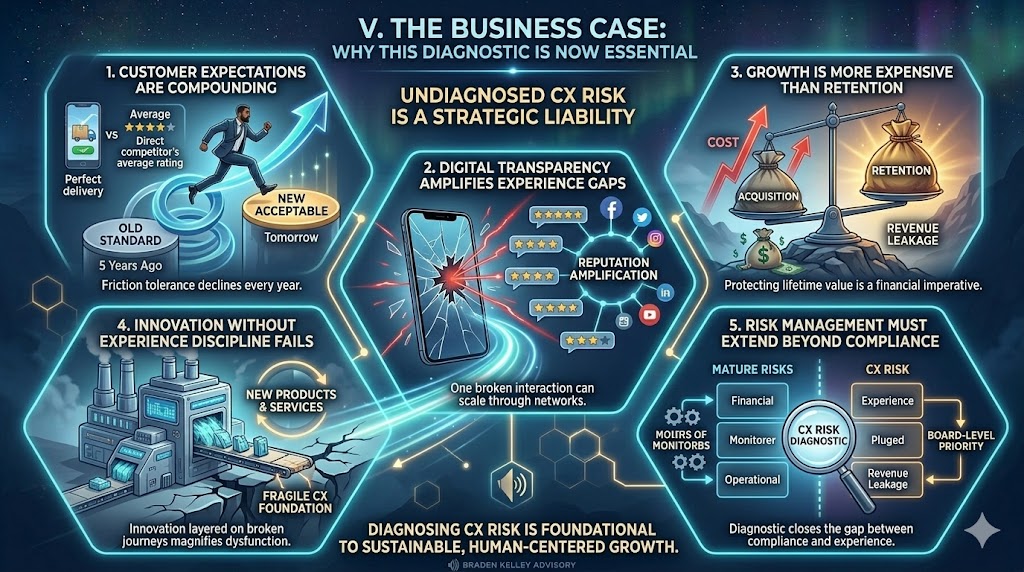
V. El caso de negocio: Por qué este diagnóstico es ahora esencial

La pregunta ya no es si la experiencia del cliente importa. La pregunta es si puede permitirse dejarla sin diagnosticar.

La dinámica del mercado ha cambiado. Las expectativas se han acelerado. La transparencia ha aumentado. Los costos de adquisición siguen subiendo. En este entorno, el riesgo de experiencia no gestionado es un pasivo estratégico.

1. Las expectativas del cliente se están acumulando

Los clientes no lo comparan solo con sus competidores directos. Lo comparan con la mejor experiencia que han tenido en cualquier lugar. La tolerancia a la fricción disminuye cada año.

Lo que parecía “aceptable” hace cinco años, ahora parece anticuado. Lo que parece ligeramente inconveniente hoy, será inaceptable mañana.

2. La transparencia digital amplifica las brechas de experiencia

Una interacción fallida puede escalar rápidamente a través de reseñas, redes sociales y redes de pares.

La inconsistencia en la experiencia ya no está contenida. La reputación se mueve a la velocidad de la visibilidad.

3. El crecimiento es más caro que la retención

Los costos de adquisición de clientes siguen aumentando en todos los sectores. Cuando los ingresos se filtran por fricciones evitables, las organizaciones se ven obligadas a gastar más solo para mantenerse en el mismo lugar.

Proteger y expandir el valor de vida del cliente es ahora un imperativo financiero, no una aspiración de marketing.

4. La innovación sin disciplina de experiencia falla

Las organizaciones invierten fuertemente en nuevos productos, servicios y tecnologías. Pero la innovación aplicada sobre trayectos defectuosos simplemente magnifica la disfunción.

La escala amplifica cualquier sistema que se tenga, sea bueno o malo. Si la base de la experiencia es frágil, las iniciativas de crecimiento expondrán las grietas.

5. La gestión de riesgos debe extenderse más allá del cumplimiento

La mayoría de las empresas cuentan con marcos de riesgo financiero y operativo maduros. Pocas aplican un rigor equivalente al riesgo de la experiencia del cliente.

Un Diagnóstico de Riesgo de Experiencia del Cliente y Fuga de Ingresos cierra esa brecha, elevando la experiencia de ser una preocupación funcional a una prioridad de gestión de riesgos y desempeño a nivel de junta directiva.

En el entorno actual, diagnosticar el riesgo de experiencia no es opcional. Es fundamental para un crecimiento sostenible y centrado en el ser humano.
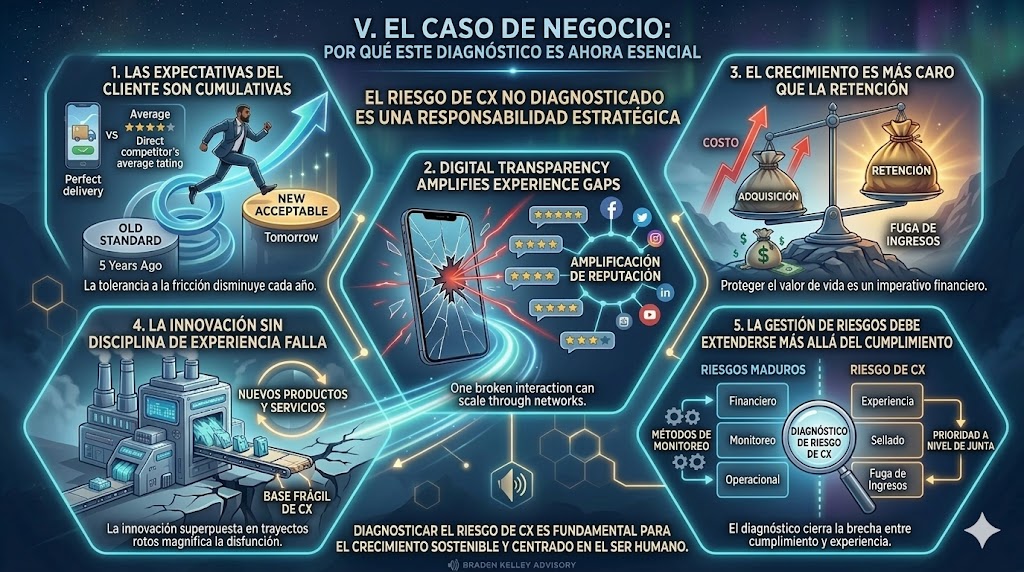
Caso de Negocio del Diagnóstico de Riesgo de CX y Fuga de Ingresos

VI. Qué mide realmente un diagnóstico de alto impacto

Si va a tratar la experiencia del cliente como una disciplina de crecimiento y riesgo, debe medirla con el mismo rigor que aplica al desempeño financiero. Un Diagnóstico de Riesgo de Experiencia del Cliente y Fuga de Ingresos de alto impacto va mucho más allá de las puntuaciones de sentimiento.

Evalúa la exposición, las causas raíz y las implicaciones financieras en todo el ciclo de vida del cliente.

A. Exposición al riesgo a nivel de trayecto

El diagnóstico identifica dónde los clientes dudan, luchan o se desconectan en etapas clave del trayecto.

  • Patrones de caída y abandono
  • Retrasos en el tiempo de ciclo
  • Tasas de escalada y contacto repetido
  • Transiciones inconsistentes entre canales

En lugar de mirar los promedios, aísla puntos de contacto específicos de alto riesgo donde la fricción se agrava y los ingresos se vuelven vulnerables.

B. Puntos de fricción emocional

No todo el riesgo es operativo. Algunas de las fugas más costosas comienzan a nivel emocional.

  • Momentos de incertidumbre o confusión
  • Momentos de percepción de injusticia
  • Momentos donde se pone a prueba la confianza
  • Momentos en los que los clientes se sienten ignorados

La fricción emocional reduce la confianza, y una menor confianza disminuye el compromiso, la expansión y la recomendación.

C. Causas raíz operativas

Los diagnósticos de alto impacto no se quedan en los síntomas. Rastrean la fricción hasta sus impulsores sistémicos.

  • Restricciones impulsadas por políticas
  • Brechas en la integración tecnológica
  • Datos y derechos de decisión aislados
  • Incentivos y métricas de desempeño desalineados

La complejidad interna inevitablemente surge como dolor externo para el cliente. Las soluciones sostenibles requieren una visión estructural.

D. Modelado de impacto financiero

El componente más crítico es la cuantificación. La fricción debe traducirse a términos financieros.

  • Ingresos en riesgo por etapa del trayecto
  • Erosión del valor de vida del cliente
  • Inflación del costo de servicio
  • Compresión del margen impulsada por la recuperación del servicio

Cuando las fallas de experiencia se expresan en dinero, la priorización se vuelve más clara y la alineación se acelera.

Un diagnóstico de alto impacto hace visible lo invisible, no solo emocionalmente, sino económicamente.

VII. De la visión a la acción: convirtiendo el riesgo en recuperación

Un diagnóstico sin activación es puro teatro.

El conocimiento por sí solo no recupera ingresos. La conciencia por sí sola no restaura la confianza. Si los hallazgos de un Diagnóstico de Riesgo de Experiencia del Cliente y Fuga de Ingresos no cambian el comportamiento, la estructura y las decisiones de inversión, entonces la organización simplemente ha producido un informe más sofisticado.

El objetivo no es el entendimiento. El objetivo es la recuperación.

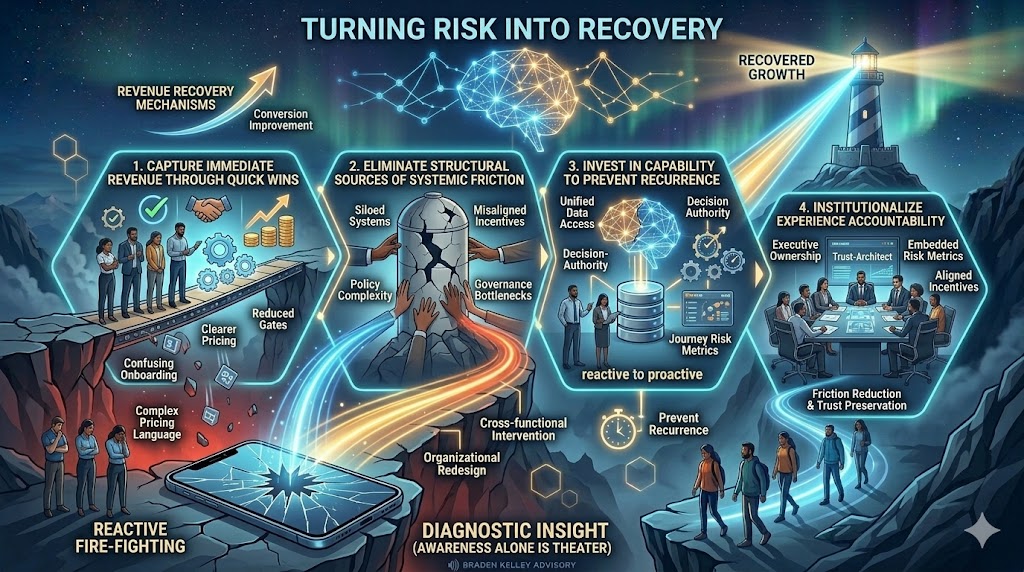
1. Capturar ingresos inmediatos a través de victorias rápidas

Cada diagnóstico saca a la superficie puntos de fricción que pueden resolverse rápidamente:

  • Simplificar pasos de incorporación confusos
  • Aclarar el lenguaje de los precios
  • Reducir filtros de aprobación redundantes
  • Corregir puntos de falla de soporte de alto volumen

Estas no son mejoras cosméticas. Son mecanismos de recuperación de ingresos. Cuando la fricción disminuye, la conversión mejora. Cuando la claridad aumenta, la vacilación disminuye. Las victorias tempranas crean impulso organizacional y demuestran que la disciplina de experiencia impulsa resultados financieros.

2. Eliminar fuentes estructurales de fricción sistémica

Algunas fugas no son tácticas. Son arquitectónicas.

Sistemas aislados. Incentivos desalineados. Complejidad impulsada por políticas. Cuellos de botella en la gobernanza.

Estos requieren intervención multifuncional. Aquí es donde importa el valor del liderazgo. Porque la fricción estructural generalmente no es propiedad de nadie y es tolerada por todos.

La verdadera recuperación exige rediseñar cómo trabaja la organización, no solo cómo se ve el trayecto del cliente.

3. Invertir en capacidad para prevenir la recurrencia

Las fallas de experiencia a menudo se remontan a brechas de capacidad:

  • Empleados de primera línea sin autoridad para decidir
  • Equipos sin acceso a datos unificados de clientes
  • Líderes sin visibilidad de las métricas de riesgo a nivel de trayecto

Si la organización no puede detectar la fricción a tiempo, seguirá perdiendo ingresos silenciosamente. La inversión en capacidad convierte la extinción reactiva de incendios en una orquestación proactiva.

4. Institucionalizar la responsabilidad de la experiencia

El cambio duradero requiere gobernanza.

Eso significa:

  • Asignar la propiedad ejecutiva de la salud del trayecto
  • Integrar métricas de riesgo de experiencia en los tableros de desempeño
  • Alinear los incentivos con la reducción de la fricción y la preservación de la confianza

La medición moldea el comportamiento. Cuando el riesgo de experiencia se mide financieramente, deja de ser una preocupación “blanda” y se convierte en una prioridad de la junta directiva.

El Cambio

Cuando las organizaciones pasan de la visión a la acción, la narrativa cambia.

No estamos mejorando la satisfacción del cliente.
Estamos recuperando el crecimiento.
Estamos protegiendo el margen.
Estamos fortaleciendo la confianza.

Un Diagnóstico de Riesgo de Experiencia del Cliente y Fuga de Ingresos no es la meta. Es el punto de ignición. Lo que importa es lo que la organización haga después: qué tan rápido actúe, qué tan audazmente rediseñe y qué tan profundamente se comprometa con la rendición de cuentas centrada en el ser humano.

Porque la fricción se acumula.

Pero también lo hace la recuperación disciplinada.
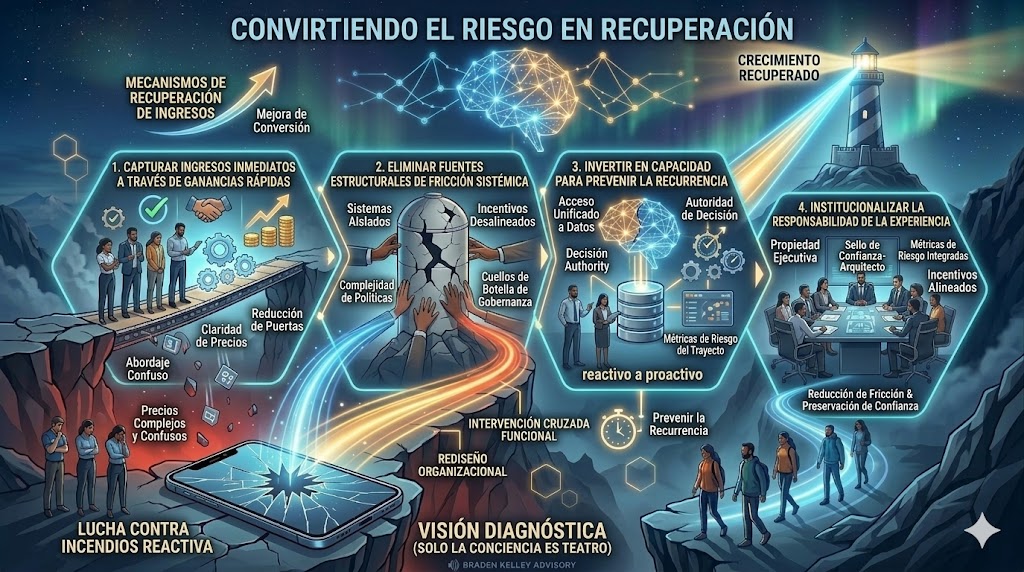
Convirtiendo el Riesgo en Recuperación

VIII. El impacto cultural

Realizar un Diagnóstico de Riesgo de Experiencia del Cliente y Fuga de Ingresos no se trata solo de números y tableros. Es un catalizador para la transformación cultural.

Cuando una organización cuantifica el riesgo de experiencia, envía una señal clara: los resultados del cliente son inseparables del desempeño del negocio.

Cambios culturales clave

  • Las finanzas prestan atención: La fuga de ingresos es ahora medible y visible, lo que la convierte en una preocupación de la junta directiva en lugar de una noción abstracta.
  • Las operaciones se involucran: Los equipos de primera línea ven cómo sus acciones influyen directamente en los resultados financieros, motivando la resolución proactiva de problemas.
  • El liderazgo prioriza: La planificación estratégica incorpora el riesgo de experiencia como una dimensión clave junto con los objetivos de costo, eficiencia y crecimiento.
  • Los empleados ganan claridad: Todos entienden cómo las decisiones del día a día impactan en la confianza del cliente, la lealtad y los ingresos.

La conversación cambia de:

“¿Qué tan satisfechos están nuestros clientes?”

A una pregunta más estratégica y procesable:

“¿Cuánto crecimiento estamos dejando sobre la mesa?”

Este cambio cultural integra la responsabilidad por la experiencia en todos los niveles de la organización. Mueve la experiencia del cliente de ser una iniciativa departamental a ser una disciplina de desempeño en toda la empresa.

En última instancia, las organizaciones que adoptan esta mentalidad son más ágiles, más resilientes y más capaces de mantener un crecimiento rentable.

IX. El imperativo del liderazgo

El cambio centrado en el ser humano comienza con líderes que están dispuestos a ver la realidad con claridad. Un Diagnóstico de Riesgo de Experiencia del Cliente y Fuga de Ingresos proporciona el lente para identificar la fricción oculta, cuantificar su impacto y priorizar la acción.

El liderazgo no puede permitirse confiar en suposiciones, comentarios anecdóticos o métricas retrospectivas. El futuro del crecimiento está determinado por qué tan bien la organización previene las fugas antes de que aparezcan en el balance general.

Principios fundamentales para líderes

  • Ver la realidad con claridad: Reconocer que la fricción y la erosión de la confianza son amenazas reales y medibles para los ingresos y la lealtad.
  • Medir lo que realmente importa: Ir más allá de las métricas de NPS, CSAT y abandono. Cuantificar el ingreso en riesgo y el impacto financiero de las fallas de experiencia.
  • Actuar proactivamente: Usar los conocimientos del diagnóstico para guiar intervenciones inmediatas, mejoras estructurales y desarrollo de capacidades.
  • Integrar la responsabilidad: Hacer que el riesgo de experiencia sea una responsabilidad compartida entre funciones, no una iniciativa aislada.

Un diagnóstico sin activación del liderazgo es solo un informe. El verdadero impacto llega cuando los conocimientos se operacionalizan, convirtiendo el riesgo en recuperación y la fricción en oportunidad.

En última instancia, los líderes que adoptan este enfoque cambian la conversación organizacional de:

“¿Estamos ofreciendo buenas experiencias?”

A una pregunta más estratégica y urgente:

“¿Dónde estamos poniendo en riesgo involuntariamente los ingresos futuros y cómo lo solucionamos?”

Este es el imperativo del liderazgo: ver, medir, actuar e integrar una cultura donde la experiencia del cliente impulse el crecimiento sostenible.

X. Reflexión final

La innovación no falla porque las ideas sean débiles. Falla porque el sistema de experiencia no puede sostenerlas. Un producto, servicio o solución brillante no puede prosperar si la fricción, las brechas de confianza o las limitaciones operativas bloquean su camino hacia el cliente.

Si desea un crecimiento sostenible, tres imperativos son claros:

  1. Deje de adivinar: Descubra la fricción oculta y la fuga de ingresos antes de que escale.
  2. Deje de confiar en indicadores retrospectivos: Las métricas tradicionales por sí solas no revelarán los riesgos silenciosos que socavan el crecimiento.
  3. Diagnostique, cuantifique y actúe: Traduzca los conocimientos en intervenciones inmediatas, correcciones estructurales e inversiones en capacidad.

Porque lo que no puede ver eventualmente aparecerá: en el abandono, en la compresión de márgenes y en la pérdida de relevancia. Esperar hasta que aparezca en los estados financieros es demasiado tarde.

Un Diagnóstico de Riesgo de Experiencia del Cliente y Fuga de Ingresos otorga a las organizaciones la claridad, el rigor y la previsión necesarios para proteger los ingresos, fortalecer la confianza y permitir que la innovación escale con éxito.

Al final, el diagnóstico no es solo una herramienta. Es una mentalidad estratégica: medir lo que importa, ver la realidad y actuar con decisión. Aquellos que lo adopten no solo sobrevivirán a la disrupción, sino que prosperarán en ella.


Reserve hoy mismo su Diagnóstico de Riesgo de Experiencia del Cliente y Fuga de Ingresos con Braden Kelley


Preguntas frecuentes: Diagnóstico de Riesgo de Experiencia del Cliente y Fuga de Ingresos

1. ¿Qué es exactamente un Diagnóstico de Riesgo de Experiencia del Cliente y Fuga de Ingresos?

Es una evaluación estructurada que identifica puntos de fricción a lo largo del trayecto del cliente, mide el impacto financiero de las fallas de experiencia y prioriza acciones para reducir el riesgo y recuperar los ingresos perdidos. A diferencia de las encuestas tradicionales, conecta la experiencia del cliente directamente con resultados comerciales medibles.

2. ¿En qué se diferencia este diagnóstico de las métricas tradicionales de CX como NPS o CSAT?

Las métricas tradicionales son indicadores retrospectivos que informan sobre lo que ya sucedió. Un diagnóstico profundiza al descubrir fuentes ocultas de fricción y erosión de la confianza, cuantificando el ingreso en riesgo y vinculando los puntos de contacto operativos y emocionales con consecuencias financieras tangibles. Transforma la CX de una medida cualitativa en una herramienta estratégica de riesgo y crecimiento.

3. ¿Quién se beneficia de este diagnóstico dentro de la organización?

Todos se benefician, desde el liderazgo hasta los empleados de primera línea. Los líderes obtienen visibilidad sobre el riesgo y la oportunidad financiera, los equipos de operaciones entienden dónde centrar las mejoras y los empleados ven cómo las acciones diarias impactan la confianza del cliente y los ingresos. Alinea a toda la organización en torno a resultados de experiencia medibles.


Reserve hoy mismo su Diagnóstico de Riesgo de Experiencia del Cliente y Fuga de Ingresos con Braden Kelley


Créditos de imagen: ChatGPT, Google Gemini (click here for the English version)

Declaración de autenticidad del contenido: El área temática, los elementos clave en los que centrarse, etc., fueron decisiones tomadas por Braden Kelley, con una pequeña ayuda de ChatGPT para limpiar el artículo y añadir citas.

Suscríbase al semanario Human-Centered Change & InnovationRegístrese aquí para recibir semanalmente en su bandeja de entrada el boletín Human-Centered Change & Innovation.
The Reality Rule for Business

The Reality Rule for Business

GUEST POST from Shep Hyken

Most of us learned the Golden Rule at a young age: “Do unto others as you would have them do unto you.” This is a perfect rule for business, and specifically customer service and customer experience (CX). It translates into treating customers the way you want to be treated. It makes sense … or does it?

My colleague Dr. Tony Alessandra came up with a version of the Golden Rule he calls the Platinum Rule: “Do unto others as they would like done unto them.” Changing two words, you to them, in this rule means not everyone wants to be treated the in same way you might like to be treated. And in a broader sense, not everyone wants to be treated the same way.

However, when it comes to certain customers, no matter how you treat them, it doesn’t matter. If you don’t recognize this, it can break both employee satisfaction and customer satisfaction. That means it can also break a business.

The Expectation Trap

Recently, I read Give Hospitality by Taylor Scott, which tells the story of an employee who left her job because of a toxic workplace culture and found the perfect job where people, both employees and customers, were treated with respect and dignity. In her second week of training, she read a quote displayed on the company’s training room wall:

“Nothing in the Golden Rule says others will treat us as we have treated them. It only says we must treat others the way we would want to be treated.” – Rosa Parks

This quote from the legendary civil rights activist highlights a basic truth about customer service: exceptional treatment of customers doesn’t guarantee the customer will respond the same way. Yet many front-line employees and managers fall into the expectation trap and become frustrated when customers remain difficult despite receiving outstanding service.

The Danger of Misplaced Expectations

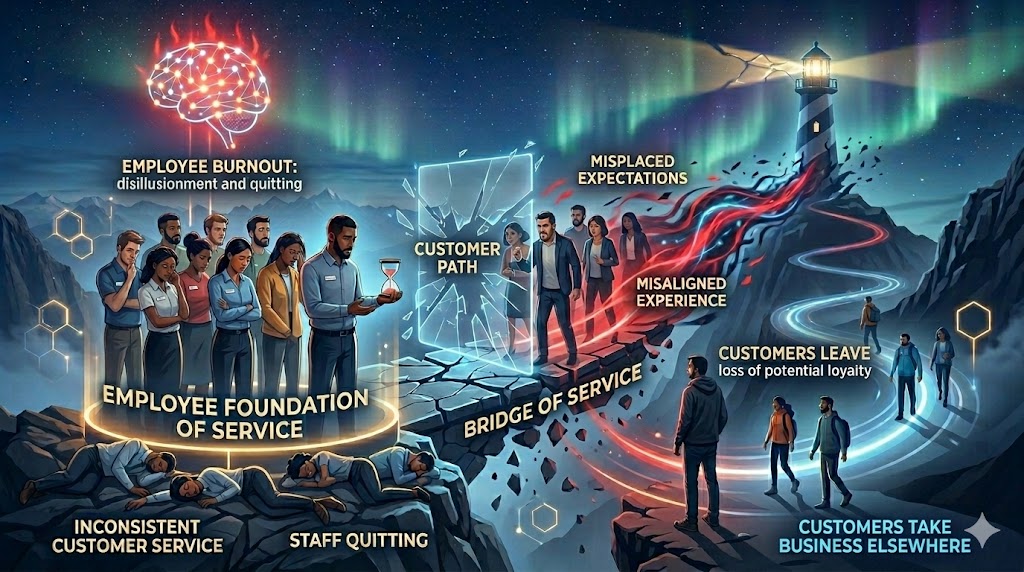
When employees expect customers to change their behavior to mirror that of employees, there is a possible danger of:

  • Employee Burnout: Front-line staff become disillusioned when their exceptional effort to take care of their customers isn’t appreciated or met with a more positive response. This is one of the top reasons it’s hard to keep good customer service reps. They say, “I can’t take it anymore,” and quit.
  • Inconsistent Customer Service: Frustrated employees may begin to take on the attitudes of their difficult customers, creating an inconsistent and bad experience for other customers.
  • Customers Leave: Difficult customers can become your most loyal customers when their problems are resolved with patience, kindness and professionalism, even if they don’t show it in their reactions. To avoid this, employees must be persistent and follow a new rule. (Read on!)

The Danger of Misplaced Expectations

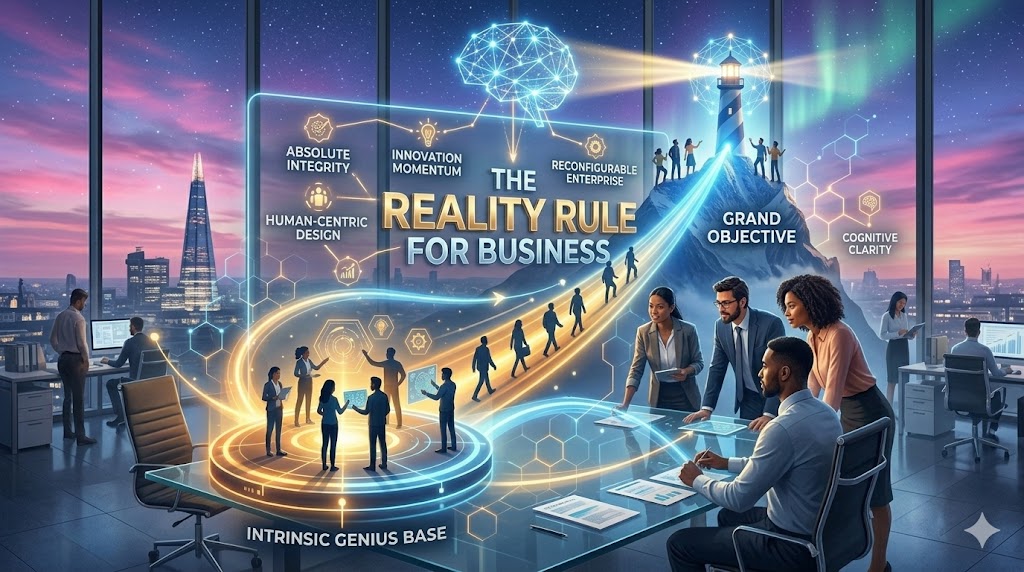
The Reality Rule

Up until now, we have had the Golden Rule and the Platinum Rule. Now we have the Reality Rule:

Treat customers well, even if they don’t treat you well.

This isn’t about unacceptable abuse from a customer. Customers who cross the line with verbal abuse and threats fall under the category of Customers Who Aren’t Worth Doing Business With. Customers are allowed to be angry and agitated. They may be upset about the company or a product, and sometimes their behavior is driven by factors beyond your control.

The Reality Rule has three components:

  1. Control Your Response: While you can’t control the customer’s behavior, you have complete control over your attitude, effort and professionalism. Don’t let your angry customer’s behavior cause you to derail.
  2. Be Consistent: You know what it takes to deliver a great experience. Stay true to the core value of taking care of customers and, as just mentioned and worth mentioning again, don’t let your angry customer’s behavior cause you to go off track.
  3. Turn Foes into Friends: This is more of a goal than a rule, but it’s a goal you must start with in every tenuous interaction. My annual customer service and CX research finds that 81% of customers said they would consider returning to a company if it actively sought to make amends for a bad customer experience. When you handle a complaint properly, the customer will have higher confidence in you and your company than if the problem had never happened at all.

Final Words

When your team embraces the Reality Rule, magic happens. Difficult customers often transform into loyal advocates. Employee satisfaction increases when they understand their role and what they have control over. And your organization builds a reputation for taking care of customers, even when there are problems or complaints.

Remember, you’re not treating customers well because you expect them to change their behavior, although it’s nice when it happens — and sometimes it does. You’re doing it because it’s the right thing to do, knowing in the long run it pays dividends to properly manage problems and complaints. The Reality Rule creates the kind of experience that gets customers to say, “I’ll be back!”

This article was originally published on Forbes.com.

Image credits: Google Gemini

Subscribe to Human-Centered Change & Innovation WeeklySign up here to join 17,000+ leaders getting Human-Centered Change & Innovation Weekly delivered to their inbox every week.

You Need a Customer Experience Risk & Revenue Leakage Diagnostic

Why You’re Losing More Than You Think — and Don’t Even Know It

LAST UPDATED: May 29, 2026 at 6:27 PM (SPANISH LANGUAGE VERSION)

You Need a Customer Experience Risk & Revenue Leakage Diagnostic

by Braden Kelley and Art Inteligencia


I. The Invisible Cost of Friction

Most organizations measure revenue. Some measure profit. A growing number measure customer satisfaction. But very few measure revenue at risk — and almost none systematically measure experience-driven revenue leakage.

The hard truth is this: what customers experience today determines what finance reports tomorrow. Friction in the customer journey rarely shows up immediately on a balance sheet. Instead, it accumulates quietly — in hesitation, in doubt, in abandoned transactions, in unresolved issues, and in eroding trust.

Every confusing onboarding flow. Every policy that makes sense internally but frustrates externally. Every moment where a customer has to work harder than they expected. These are not minor inconveniences. They are micro-withdrawals from future growth.

When friction compounds, it becomes invisible leakage:

  • Customers buy less than they intended.
  • Customers delay decisions.
  • Customers quietly explore alternatives.
  • Customers leave without complaint.

Because traditional dashboards focus on lagging indicators, leaders often miss the early warning signs. By the time churn rises or margins compress, the experience damage has already been done.

Customer experience is not a “soft” discipline. It is a leading indicator of financial performance. If you are not measuring friction financially, you are tolerating it culturally.

The first step toward sustainable growth is acknowledging a simple but uncomfortable reality: what you cannot see is already costing you.

II. What Is a Customer Experience Risk & Revenue Leakage Diagnostic?

A Customer Experience Risk & Revenue Leakage Diagnostic (aka Customer Experience Audit) is a structured, cross-functional assessment designed to uncover where your organization is unintentionally creating friction, eroding trust, and putting future revenue at risk.

It is not a satisfaction survey. It is not a brand perception study. And it is not a one-time journey mapping workshop.

It is a strategic instrument that connects customer experience directly to financial performance.

At its core, the diagnostic is designed to:

  1. Identify friction across the end-to-end customer journey
    From awareness and onboarding to service and renewal, it reveals where customers hesitate, struggle, or disengage.
  2. Quantify the financial impact of experience breakdowns
    It translates moments of frustration into measurable revenue exposure, cost-to-serve distortion, and lifetime value erosion.
  3. Prioritize improvements based on risk and recovery potential
    It enables leadership to focus on interventions that reduce risk, restore trust, and unlock trapped growth.

Unlike traditional CX metrics that tell you what happened, this diagnostic helps you understand why it happened — and what it is costing you.

By integrating operational data, customer feedback, employee insight, and financial modeling, the organization gains a clear view of:

  • Where revenue is quietly leaking
  • Where trust is weakening
  • Where internal complexity is surfacing as external pain
  • Where competitors are gaining advantage through simplicity

In short, a Customer Experience Risk & Revenue Leakage Diagnostic reframes customer experience from a qualitative aspiration into a measurable performance and risk management discipline.

III. Why Traditional Metrics Fail

Most organizations believe they are measuring customer experience effectively. They track Net Promoter Score (NPS), Customer Satisfaction (CSAT), conversion rates, churn rates, and average handle time. These metrics are familiar. They are benchmarked. They are reported to leadership regularly.

The problem is not that these metrics are wrong. The problem is that they are incomplete — and mostly lagging indicators.

They tell you what happened. They rarely tell you why it happened. And almost never do they tell you what it is costing you before it shows up in revenue.

The Three Core Limitations

  1. They Measure Sentiment, Not Exposure
    A customer can report being “satisfied” while still experiencing friction that reduces purchase frequency, basket size, or long-term loyalty.
  2. They Are Aggregated and Diluted
    Journey-level breakdowns are often hidden inside company-wide averages. A single high-friction touchpoint can erode trust even if the overall score appears stable.
  3. They Are Backward-Looking
    By the time churn rises or referrals fall, the experience damage has already compounded. Leadership is reacting to symptoms, not preventing causes.

Most importantly, traditional metrics rarely connect experience breakdowns directly to financial risk. Without that connection, friction becomes normalized.

Measurement shapes behavior. If you do not measure friction in financial terms, you unintentionally signal that it is tolerable.

A Customer Experience Risk & Revenue Leakage Diagnostic shifts the focus from “How are we scoring?” to a far more strategic question:

“Where are we unintentionally putting future revenue at risk?”

That reframing changes the conversation — from reporting outcomes to preventing loss and unlocking growth.

IV. The Four Hidden Sources of Revenue Leakage

Revenue rarely disappears in dramatic fashion. It erodes quietly — through friction, misalignment, and unexamined assumptions. Most organizations don’t have a revenue problem. They have a leakage problem.

A Customer Experience Risk & Revenue Leakage Diagnostic exposes four primary sources of hidden loss.

1. Friction Leakage

Friction leakage occurs when customers encounter unnecessary effort, confusion, or delay throughout their journey.

  • Abandoned carts and incomplete applications
  • Complicated onboarding experiences
  • Repetitive support interactions
  • Opaque pricing or renewal processes

Every moment of confusion acts as a micro-tax on growth. Individually small. Collectively significant.

2. Trust Leakage

Trust leakage is more subtle — and more dangerous. It happens when promises and delivery drift apart.

  • Inconsistent messaging across channels
  • Unmet service commitments
  • Poor recovery after failure
  • Policy decisions that prioritize internal efficiency over customer fairness

Trust is the invisible infrastructure of sustainable growth. When it weakens, customers may not complain — they simply reduce engagement.

3. Capability Leakage

Capability leakage originates inside the organization but manifests externally. It occurs when employees lack the tools, authority, or alignment needed to deliver a seamless experience.

  • Siloed data systems
  • Disconnected technology platforms
  • Incentives that reward internal metrics over customer outcomes
  • Front-line employees unable to resolve issues without escalation

Internal complexity always becomes external friction.

4. Strategic Blind Spots

Strategic leakage occurs when leadership decisions unintentionally trade long-term growth for short-term optimization.

  • Cost-cutting that degrades customer value
  • Underinvestment in journey orchestration
  • Failure to listen to front-line and edge-of-organization insights
  • Overconfidence in lagging indicators

The edges of the organization are where the future first becomes visible. If leadership is not looking there, risk compounds silently.

When these four forms of leakage intersect, the financial impact multiplies. The diagnostic does not just identify them — it quantifies them, transforming abstract experience concerns into measurable business priorities.

V. The Business Case: Why This Diagnostic Is Now Essential

The question is no longer whether customer experience matters. The question is whether you can afford to leave it undiagnosed.

Market dynamics have shifted. Expectations have accelerated. Transparency has increased. Acquisition costs continue to rise. In this environment, unmanaged experience risk is a strategic liability.

1. Customer Expectations Are Compounding

Customers do not compare you only to direct competitors. They compare you to the best experience they have had anywhere. Friction tolerance declines every year.

What felt “acceptable” five years ago now feels outdated. What feels slightly inconvenient today becomes unacceptable tomorrow.

2. Digital Transparency Amplifies Experience Gaps

One broken interaction can scale rapidly through reviews, social platforms, and peer networks.

Experience inconsistency is no longer contained. Reputation moves at the speed of visibility.

3. Growth Is More Expensive Than Retention

Customer acquisition costs continue to climb across industries. When revenue leaks through preventable friction, organizations are forced to spend more just to stand still.

Protecting and expanding lifetime value is now a financial imperative — not a marketing aspiration.

4. Innovation Without Experience Discipline Fails

Organizations invest heavily in new products, services, and technologies. But innovation layered on top of broken journeys simply magnifies dysfunction.

Scale amplifies whatever system you have — good or bad. If the experience foundation is fragile, growth initiatives will expose the cracks.

5. Risk Management Must Extend Beyond Compliance

Most enterprises have mature financial and operational risk frameworks. Few have equivalent rigor applied to customer experience risk.

A Customer Experience Risk & Revenue Leakage Diagnostic closes that gap, elevating experience from a functional concern to a board-level performance and risk management priority.

In today’s environment, diagnosing experience risk is not optional. It is foundational to sustainable, human-centered growth.

CX Risk and Revenue Leakage Diagnostic Business Case

VI. What a High-Impact Diagnostic Actually Measures

If you are going to treat customer experience as a growth and risk discipline, you must measure it with the same rigor you apply to financial performance. A high-impact Customer Experience Risk & Revenue Leakage Diagnostic goes far beyond sentiment scores.

It evaluates exposure, root causes, and financial implications — across the entire customer lifecycle.

A. Journey-Level Risk Exposure

The diagnostic identifies where customers hesitate, struggle, or disengage across key stages of the journey.

  • Drop-off and abandonment patterns
  • Cycle time delays
  • Escalation and repeat contact rates
  • Inconsistent cross-channel transitions

Rather than looking at averages, it isolates specific high-risk touchpoints where friction compounds and revenue becomes vulnerable.

B. Emotional Friction Points

Not all risk is operational. Some of the most expensive leakage begins at the emotional level.

  • Moments of uncertainty or confusion
  • Moments of perceived unfairness
  • Moments where trust is tested
  • Moments where customers feel unheard

Emotional friction reduces confidence — and reduced confidence lowers commitment, expansion, and advocacy.

C. Operational Root Causes

High-impact diagnostics do not stop at symptoms. They trace friction back to systemic drivers.

  • Policy-driven constraints
  • Technology integration gaps
  • Siloed data and decision rights
  • Misaligned incentives and performance metrics

Internal complexity inevitably surfaces as external customer pain. Sustainable solutions require structural insight.

D. Financial Impact Modeling

The most critical component is quantification. Friction must be translated into financial terms.

  • Revenue at risk by journey stage
  • Lifetime value erosion
  • Cost-to-serve inflation
  • Margin compression driven by service recovery

When experience breakdowns are expressed in dollars, prioritization becomes clearer and alignment accelerates.

A high-impact diagnostic makes the invisible visible — not just emotionally, but economically.

VII. From Insight to Action: Turning Risk into Recovery

A diagnostic without activation is theater.

Insight alone does not recover revenue. Awareness alone does not restore trust. If the findings from a Customer Experience Risk & Revenue Leakage Diagnostic do not change behavior, structure, and investment decisions, then the organization has simply produced a more sophisticated report.

The goal is not understanding. The goal is recovery.

1. Capture Immediate Revenue Through Quick Wins

Every diagnostic surfaces friction points that can be resolved quickly:

  • Simplifying confusing onboarding steps
  • Clarifying pricing language
  • Reducing redundant approval gates
  • Fixing high-volume support failure points

These are not cosmetic improvements. They are revenue recovery mechanisms. When friction decreases, conversion improves. When clarity increases, hesitation declines. Early wins build organizational momentum and prove that experience discipline drives financial results.

2. Eliminate Structural Sources of Systemic Friction

Some leakage is not tactical. It is architectural.

Siloed systems. Misaligned incentives. Policy-driven complexity. Governance bottlenecks.

These require cross-functional intervention. This is where leadership courage matters. Because structural friction is usually owned by no one — and tolerated by everyone.

True recovery demands redesigning how the organization works, not just how the customer journey looks.

3. Invest in Capability to Prevent Recurrence

Experience breakdowns often trace back to capability gaps:

  • Frontline employees without decision authority
  • Teams without access to unified customer data
  • Leaders without visibility into journey-level risk metrics

If the organization cannot detect friction early, it will continue to leak revenue quietly. Capability investment turns reactive firefighting into proactive orchestration.

4. Institutionalize Experience Accountability

Lasting change requires governance.

That means:

  • Assigning executive ownership for journey health
  • Embedding experience risk metrics into performance dashboards
  • Aligning incentives with friction reduction and trust preservation

Measurement shapes behavior. When experience risk is measured financially, it stops being a “soft” concern and becomes a board-level priority.

The Shift

When organizations move from insight to action, the narrative changes.

We are not improving customer satisfaction.
We are recovering growth.
We are protecting margin.
We are strengthening trust.

A Customer Experience Risk & Revenue Leakage Diagnostic is not the finish line. It is the ignition point. What matters is what the organization does next — how quickly it acts, how boldly it redesigns, and how deeply it commits to human-centered accountability.

Because friction compounds.

But so does disciplined recovery.

Turning Risk Into Recovery

VIII. The Cultural Impact

Conducting a Customer Experience Risk & Revenue Leakage Diagnostic is not just about numbers and dashboards. It is a catalyst for cultural transformation.

When an organization quantifies experience risk, it sends a clear signal: customer outcomes are inseparable from business performance.

Key Cultural Shifts

  • Finance Pays Attention: Revenue leakage is now measurable and visible, making it a board-level concern rather than an abstract notion.
  • Operations Engage: Front-line teams see how their actions directly influence financial outcomes, motivating proactive problem-solving.
  • Leadership Prioritizes: Strategic planning incorporates experience risk as a key dimension alongside cost, efficiency, and growth targets.
  • Employees Gain Clarity: Everyone understands how day-to-day decisions impact customer trust, loyalty, and revenue.

The conversation shifts from:

“How satisfied are our customers?”

To a more strategic and actionable question:

“How much growth are we leaving on the table?”

This cultural shift embeds accountability for experience across all levels of the organization. It moves customer experience from a departmental initiative to an enterprise-wide performance discipline.

Ultimately, organizations that embrace this mindset are more agile, more resilient, and more capable of sustaining profitable growth.

IX. The Leadership Imperative

Human-centered change begins with leaders who are willing to see reality clearly. A Customer Experience Risk & Revenue Leakage Diagnostic provides the lens to identify hidden friction, quantify its impact, and prioritize action.

Leadership cannot afford to rely on assumptions, anecdotal feedback, or lagging metrics. The future of growth is determined by how well the organization prevents leakage before it appears on the balance sheet.

Core Principles for Leaders

  • See Reality Clearly: Recognize that friction and trust erosion are real, measurable threats to revenue and loyalty.
  • Measure What Truly Matters: Go beyond NPS, CSAT, and churn metrics. Quantify revenue at risk and the financial impact of experience breakdowns.
  • Act Proactively: Use diagnostic insights to guide immediate interventions, structural improvements, and capability development.
  • Embed Accountability: Make experience risk a shared responsibility across functions, not a siloed initiative.

A diagnostic without leadership activation is just a report. True impact comes when insights are operationalized, turning risk into recovery and friction into opportunity.

Ultimately, leaders who embrace this approach shift the organizational conversation from:

“Are we delivering good experiences?”

To a more strategic and urgent question:

“Where are we unintentionally putting future revenue at risk, and how do we fix it?”

This is the leadership imperative: see, measure, act, and embed a culture where customer experience drives sustainable growth.

X. Closing Thought

Innovation does not fail because ideas are weak. It fails because the experience system cannot support them. A brilliant product, service, or solution cannot thrive if friction, trust gaps, or operational constraints block its path to the customer.

If you want sustainable growth, three imperatives are clear:

  1. Stop guessing: Uncover hidden friction and revenue leakage before it escalates.
  2. Stop relying on lagging indicators: Traditional metrics alone will not reveal the silent risks undermining growth.
  3. Diagnose, quantify, and act: Translate insights into immediate interventions, structural fixes, and capability investments.

Because what you cannot see will eventually show up — in churn, in margin compression, and in lost relevance. Waiting until it appears on financial statements is too late.

A Customer Experience Risk & Revenue Leakage Diagnostic gives organizations the clarity, rigor, and foresight needed to protect revenue, strengthen trust, and enable innovation to scale successfully.

In the end, the diagnostic is not just a tool. It is a strategic mindset: measure what matters, see reality, and act decisively. Those who embrace it will not just survive disruption — they will thrive in it.


Reserve your Customer Experience Risk & Revenue Leakage Diagnostic with Braden Kelley today


FAQ: Customer Experience Risk & Revenue Leakage Diagnostic

1. What exactly is a Customer Experience Risk & Revenue Leakage Diagnostic?

It is a structured assessment that identifies friction points across the customer journey, measures the financial impact of experience breakdowns, and prioritizes actions to reduce risk and recover lost revenue. Unlike traditional surveys, it connects customer experience directly to measurable business outcomes.

2. How does this diagnostic differ from traditional CX metrics like NPS or CSAT?

Traditional metrics are lagging indicators that report what has already happened. A diagnostic goes deeper by uncovering hidden sources of friction and trust erosion, quantifying revenue at risk, and linking operational and emotional touchpoints to tangible financial consequences. It transforms CX from a qualitative measure into a strategic risk and growth tool.

3. Who in the organization benefits from this diagnostic?

Everyone from leadership to front-line employees benefits. Leaders gain visibility into financial risk and opportunity, operations teams understand where to focus improvements, and employees see how daily actions impact customer trust and revenue. It aligns the entire organization around measurable experience outcomes.


Reserve your Customer Experience Risk & Revenue Leakage Diagnostic with Braden Kelley today


Image credits: ChatGPT, Google Gemini

Content Authenticity Statement: The topic area, key elements to focus on, etc. were decisions made by Braden Kelley, with a little help from ChatGPT to clean up the article and add citations.

Subscribe to Human-Centered Change & Innovation WeeklySign up here to get Human-Centered Change & Innovation Weekly delivered to your inbox every week.

12 Friction Points Customers Feel Before Your Journey Map Does

12 Friction Points Customers Feel Before Your Journey Map Does

by Braden Kelley and Art Inteligencia


Why Do Customers Feel Friction Before Your Journey Map Does? (Short Answer)

Customers feel friction before your journey map does because maps are stage posters, not nervous systems. They capture channels, steps, and the happy path. They miss homework before entry, the wrong door, identity theater, story-retelling, unowned waiting, handoff cliffs, life-context tax, dignity costs, status opacity, recovery that never made the swimlane, policy after “done,” and powerless humans at the moment of truth.

A journey map is a photograph of the path you already believe. Friction is what the body pays while you are still scheduling the workshop.

The Map Is a Late Instrument

I have stood in rooms where the journey map could have hung in a gallery. Stages were labeled. Emotions were color-coded. Someone had even drawn a little heart at “loyalty.”

Meanwhile, a human was still on hold in a parking lot, assembling a stack of documents your portal already has, about to retell their story for the third time — to a person who is not allowed to help.

That is not a mapping skill gap. It is a timing gap. Maps organize the path you can already see. Lived friction shows up in voids, homework, and dignity costs that workshops flatten into arrows. If you want the artifact to catch up, start with what Tuesday already knows.

Friction Why maps miss it Do instead
1. Homework before entry Mapping starts at “start” Inventory and kill unpaid pre-work
2. Wrong door Assumes they found the right journey Design wayfinding, not punishment
3. Identity theater Login is a technical box Time-to-recognized-human
4. Story-retelling tax Each lane has its own intake Context that travels; own the seam
5. Unowned waiting Wait is an arrow or omitted Design the silence with an owner
6. Handoff cliffs Arrows look like integration Seam owners, not just stages
7. Life-context tax Personas sit still at a desk Design for interrupted humans
8. Dignity costs Emotion is color, not requirement Name shame with owners and power
9. Status opacity Your stages, their fog Progress as a product
10. Unmapped recovery Happy path starts at browse Map from the mess
11. Policy after “done” Rules live in another department Surface constraints before close
12. Powerless humans Frontline is a box, not a constraint Fund authority at the moment of truth

1. What Homework Do Customers Do Before Your Journey Even Starts?

What they feel: Assembling documents, researching which form, rehearsing the call, printing what your portal already has. The journey has not “started.” The labor has.

Why the map lags: Mapping begins at awareness or start service. Unpaid pre-work is off-canvas — therefore it is nobody’s job.

Instead: Inventory the homework. Kill it or own it as a designed step with less burden. If they had to prepare to be your customer, you already charged them — in time.

2. Why Is the Wrong Door Friction Your Journey Map Never Shows?

What they feel: The wrong product, phone tree, chatbot, or department — then starting over. Lost is treated as their error.

Why the map lags: Maps assume the customer found the right journey. Wrong-door is “not our segment,” which is a polite way of saying not our poster.

Instead: Design wayfinding and first-contact triage as part of the experience, not a filter that punishes the lost. The first door is the journey.

3. How Does Identity Theater Hurt Customers Before Stages Do?

What they feel: Prove who you are again — account numbers, one-time codes, “security questions,” matching a household that does not match your system.

Why the map lags: Login is a technical box, not an emotional stage. The map never scores the humiliation of being a stranger to a company that already has your money.

Instead: Measure time-to-recognized-human. Reduce proof loops. Preserve identity across handoffs. Recognition is experience, not IT hygiene.

4. What Is the Story-Retelling Tax in Customer Experience?

What they feel: Explaining the situation to the IVR, then the agent, then the specialist, then the portal. Same wound, new clipboard.

Why the map lags: Each swimlane has its own “intake.” The artifact does not feel the repeat. Only the human does.

Instead: Context that travels. If they must retell, the seam is broken — name an owner. Retelling is not thoroughness. It is failure demand with a smile.

5. Why Is Unowned Waiting Invisible on Most Journey Maps?

What they feel: Hold music, “we’ll be in touch,” tickets with no clock, overnight voids that are not a “stage.” Anxiety has nowhere to sit on the poster.

Why the map lags: Waiting is drawn as an arrow or omitted. Arrows do not have anxiety. Silence has no swimlane.

Instead: Make wait a designed moment — what they know, when, and who is accountable for the silence. If nobody owns the gap, the customer owns the dread.

6. What Is a Handoff Cliff in Customer Experience?

What they feel: Falling between teams, systems, or shifts. The map’s neat arrow is a cliff in real life. They did not “drop off.” They were dropped.

Why the map lags: Workshops love arrows. Operating models hate owning the seam. Integration on paper is not a handshake in the work.

Instead: Seam owners, not just stage owners. Test the handoff, not the poster. If the arrow cannot name a human, it is decoration.

7. How Does Life Context Create Friction Maps Don’t Capture?

What they feel: Doing this while at work, with a child, on a bus, in a language that is not the workshop’s, on a phone with a dying battery.

Why the map lags: Personas sit still at a desk in a dedicated “user hour.” Real customers do not. Interrupted life is treated as edge case.

Instead: Design for interrupted, mobile, exhausted humans. If it only works in the lab’s quiet hour, it does not work.

8. Which Dignity Costs Do Journey Maps Soften Into Color?

What they feel: Shame. Being talked down to. Proving they are not a fraud. Begging for an exception they should not have to beg for.

Why the map lags: Emotion lanes become color, not design requirements. Dignity is filed under “tone of voice.”

Instead: Name dignity failures as friction with owners — recovery power, language, and the right to be believed. If it cannot be funded, it was never a requirement. It was wallpaper.

9. Why Does Status Opacity Hurt Customers More Than Your Stages Admit?

What they feel: Not knowing what happens next, whether it worked, or who has the ball. Your internal stages are a cathedral. Their view is fog.

Why the map lags: Progress is visible to you. It is invisible to them. The map is drawn from the inside out.

Instead: Customer-facing status as a product — not a courtesy email when legal remembers. If they have to call to learn where they are, you hid the journey.

10. Why Does Recovery Friction Never Make the Happy-Path Map?

What they feel: Something already broke. The map still starts at browse, buy, onboard. Their whole journey is “please undo this.”

Why the map lags: Happy-path mapping treats failure as an exception swimlane nobody funds. Failure demand is a large share of real volume.

Instead: Map from the mess. If recovery is not a first-class journey, you are mapping a brochure.

11. How Does Policy After “Done” Betray Customers Maps Call Successful?

What they feel: Fine print, eligibility, fees, “that’s not covered” — a rule that appears after they already committed, emotionally and sometimes financially.

Why the map lags: Policy lives in a different department’s map, or in no map. The happy path ends at conversion. The ambush starts after.

Instead: Surface constraints before the emotional close. Surprise policy is not a compliance detail. It is a designed betrayal.

12. Why Do Powerless Humans Create Friction Before Your VoC Loop Does?

What they feel: A person who knows what they deserve and an employee who is not allowed to deliver it. The gap is audible in the first ten seconds.

Why the map lags: Maps show “agent / frontline” as a box, not a constraint. Voice of customer arrives after the quit or the rant — late, as maps are late.

Instead: Fund authority where the moment lives. The customer felt the power gap before your closed loop did. Enablement is not a cascade deck. It is decision rights on Tuesday.

How Do You Find Customer Friction Before You Reprint the Journey Map?

Before the next mapping offsite, answer five questions. If you cannot, you are about to photograph a path that is already lying:

  1. Where is the unpaid homework before “start”?
  2. Where do they retell the same story across seams?
  3. Where is the wait unowned — silence with no clock and no human?
  4. Where does dignity fail — shame, disbelief, begging?
  5. Where does policy ambush “done” after they thought they had finished?

If your maps still end at the wall with nobody owning the seam, that is a different failure — see 7 Ways Design Thinking Gets Misused. If listening still arrives as a dead form after the moment has passed, read Conversational and Agentic VoC. If the friction is felt and still unfunded, the budget story is in 9 Reasons Companies Underinvest in CX.

If it is not on the map yet, it is already in the customer’s Tuesday. Map late if you must. Listen early.

Frequently Asked Questions

Why do journey maps miss customer friction?

Journey maps miss friction because they are stage posters drawn from the path the organization already believes. They capture channels, steps, and happy paths while customers pay in homework, waiting, retelling, dignity costs, and seams nobody owns — voids that workshops flatten into arrows.

What friction do customers feel that maps miss?

Common missed frictions include unpaid homework before entry, the wrong door, identity theater, story-retelling, unowned waiting, handoff cliffs, life-context tax, dignity costs, status opacity, recovery that never made the happy path, policy after “done,” and powerless frontline humans at the moment of truth.

How do you find friction before mapping a customer journey?

Listen in lived time: ride-alongs, contact recordings, failure-demand tickets, and the questions customers ask while waiting. Inventory homework, retells, unowned waits, dignity failures, and policy ambushes before you reprint stages. If evidence could not have been invented in a conference room, you are getting closer.

Are customer journey maps still useful?

Yes — as a shared picture after you have contact with reality, with owners for stages and seams. They fail when they lead, when they photograph the happy path only, or when they hang on a wall with no operator for broken handoffs. Maps should follow listening, not replace it.

What is a handoff cliff in CX?

A handoff cliff is the gap between teams, systems, or shifts where the customer falls even though the journey map shows a neat arrow. The arrow is not an owner. Until someone is accountable for the seam, integration exists only on the poster.

Image credits: Pixabay

Content Authenticity Statement: The topic area, key elements to focus on, etc. were decisions made by Braden Kelley, with a little help from Pixbay and Cursor to clean up the article, add images and create infographics.

Subscribe to Human-Centered Change & Innovation WeeklySign up here to get Human-Centered Change & Innovation Weekly delivered to your inbox every week.