by Braden Kelley and Art Inteligencia
How Do You Calculate CX ROI Without Hope-Based Slideware? (Short Answer)
You calculate customer experience ROI without hope-based slideware by pricing behaviors on named journeys with your numbers — not by citing an industry NPS-to-growth chart and hoping finance translates “up and to the right” into dollars. Seven methods: retained revenue from reduced churn, failure-demand and repeat-contact cost, effort as cost-to-serve, expansion from easier buying, referral as avoided acquisition cost, the employee-attrition tax of underfunded experience, and an instrumented before/after on one intervention shown as a range.
The chain that keeps it honest is simple: experience metric → behavioral outcome → financial outcome → named intervention. If that chain breaks, you still have a slogan.
Hope Is Not a Business Case
I have sat in enough leadership rooms to recognize the moment the CX conversation dies. Someone has just shown a journey map that could win a design award. Heads have nodded. Then finance asks the only question that counts in that room: What is this worth?
What follows is usually a deck. A borrowed loyalty study. A hockey-stick that begins the quarter after implementation. A score moving “up and to the right” with no named human behavior underneath it. That is hope-based slideware. It photographs well. It does not survive a CFO who has another ask on the table with a spreadsheet attached.
Customer experience does not lose budget fights because it is soft. It loses when it stays unpriced. These seven methods put dollars on retained humans, avoided failure demand, and frontline enablement using your economics. Industry research can start the conversation. It cannot finish it.
| Method | What you price | Hope it replaces |
|---|---|---|
| 1. Retained revenue | Avoided churn on a named journey | Generic NPS-to-growth slides |
| 2. Failure demand | Repeat contacts and reopen work | “Lower effort will pay for itself” |
| 3. Effort as cost-to-serve | Minutes, rework, expensive channels | CES as a virtue metric |
| 4. Expansion from less friction | Attach, upsell, share of wallet | “Promoters buy more” posters |
| 5. Referral as avoided CAC | Incremental qualified referrals | “Word of mouth is priceless” |
| 6. Frontline attrition tax | Replacement, ramp, lost judgment | CX cases that ignore employees |
| 7. Instrumented intervention | One fix, a range, a review date | A single heroic ROI number |
1. How Do You Calculate CX ROI from Retention?
The method: Estimate avoided churn from a specific experience fix — onboarding, billing, recovery, renewal — using your churn rate, revenue per customer, and how many customers actually hit that journey.
The math: Customers on the journey × expected reduction in leave or non-renew × revenue at risk. Start with last year’s actuals, not a mid-market benchmark someone pasted from a keynote.
The trap: A loyalty-industry slide with no company economics attached. Relative NPS leaders often grow faster than laggards. That is interesting. It is not an answer to what fixing this billing surprise is worth in this book of business.
The catch: Retention is a human staying because Tuesday got easier — not because the score moved. Name the friction you are removing. If you cannot point to the journey, you are still pricing a cloud.
2. How Do You Price Failure Demand and Repeat Contacts?
The method: Count work created by the experience being wrong the first time — second calls, reopen tickets, “any update?” chats, visits to fix a prior visit. That volume is not “busy.” It is the operating cost of a broken promise.
The math: Volume of avoidable contacts × fully loaded cost per contact (or per visit). Finance usually funds your cost-to-serve first. Customer time is real; include it only if you will actually use it in the conversation, not as decoration.
The trap: “Lower effort will pay for itself” with no contact ledger. Hope loves that sentence. Spreadsheets do not.
The catch: Fast handle time that reopens the ticket is not savings. A resolution that prevents the third contact is. If your business case rewards speed that creates return work, you are pricing the wrong behavior.
3. How Do You Turn Customer Effort into Cost-to-Serve?
The method: Price the labor inside the journey — employee minutes, rework loops, and expensive-channel use caused by confusion. The IVR maze. The bill nobody can parse. The knowledge article that lies. Those are not “pain points.” They are minutes you already pay for.
The math: Minutes saved × loaded labor rate × volume, plus mix shift from high-cost channels to appropriate ones. Appropriate does not mean cheapest. A cheap channel that fails is just failure demand with a lower sticker price.
The trap: CES as a virtue metric with no dollar bridge. Effort scores without a cost model are still slideware — just more sophisticated slideware.
The catch: Do not “save” by making the human do the company’s homework. Effort reduced for the customer and the employee is the honest version. Extraction dressed up as self-service will show up later as churn, complaints, or both.
4. How Do You Calculate Expansion ROI from Better Experience?
The method: Compare spend, attach, or expansion between customers who completed a low-effort path and those who struggled — then apply a conservative lift only to the journey you are actually fixing.
The math: Eligible customers × realistic attach or expansion lift × margin, not revenue vanity. If you cannot see a cohort difference in your data yet, say the lift is modeled. Transparency survives the room. False precision does not.
The trap: “Promoters buy more” as a poster, with no evidence from this book of business. Maybe they do. Prove it or bound it.
The catch: People expand when buying is dignified and clear — not when a campaign is louder. If the friction is still there, you are not calculating expansion ROI. You are calculating the cost of shouting over a broken path.
5. How Do You Price Referrals as Avoided Acquisition Cost?
The method: Price organic advocacy from a memorable recovery or a frictionless first success. Extra qualified referrals × what you would have paid to acquire that customer.
The math: Incremental referred customers × CAC — or, if CAC is a mess of channel soup, contribution margin of a new customer. Pick one definition. Stay consistent. Do not mix them mid-deck to make the number prettier.
The trap: “Word of mouth is priceless.” That is how it stays unfunded. Priceless is a compliment. It is not a line item.
The catch: Referral is leftover from a human who felt seen — usually after a moment of truth, not after a survey ask. You do not harvest advocacy with a “please rate us” pop-up. You earn it by making Tuesday work.
6. How Do You Calculate the Employee Cost of Underfunded CX?
The method: Price what underfunded experience does to the people who deliver it: regrettable attrition, recruiting, ramp time, and lost judgment at the moment of truth. CX business cases that pretend only customers have a P&L are incomplete on purpose.
The math: Extra quits you can credibly tie to “I know what they deserve; I am not allowed to deliver it” × replacement and ramp cost. Optionally add overtime and quality dip while the seat is empty. Use HR’s loaded replacement number if they have one. Inventing a tidy figure is just hope in a different font.
The trap: Treating employee experience as a soft HR add-on while the customer case stands alone. The two costs are related. When people with recovery power leave, customers feel it next.
The catch: The intervention is enablement — staffing, tools, decision rights at the moment of truth — not a pizza party and a poster about empathy. If the case funds a workshop but not authority, you have priced theater.
7. How Do You Build a CX Business Case a CFO Will Trust?
The method: Stop modeling “CX” as a cloud. Pick one intervention. Instrument a baseline and an after. Show conservative, expected, and optimistic. Separate what is known — today’s churn, today’s cost per contact — from what is modeled — how much the fix will move the behavior.
The math: Behavior change × dollar per behavior, for the named fix, as a three-point range, with a review date. The date matters. A model with no Tuesday to check it against is still a story.
The trap: A single heroic ROI number and a forty-page appendix of other people’s research. False precision is hope wearing a spreadsheet.
The catch: Executives fund redesigned onboarding, fixed billing logic, and empowered recovery — not “+7 NPS” floating in space. Attach the dollars to an action someone can own after the meeting ends.
What Should You Check Before You Build the CX ROI Deck?
Before the next slide that asks the room to believe, run five go/no-go questions. If you cannot answer them, you are still funding hope:
- Which journey and which behavior — leave, call again, expand, refer, or quit the job?
- Which of our numbers — not whose study?
- What is known versus modeled — and did we say so out loud?
- What range survives a skeptical read — conservative, expected, optimistic?
- What intervention and owner exist on Tuesday if they believe the number?
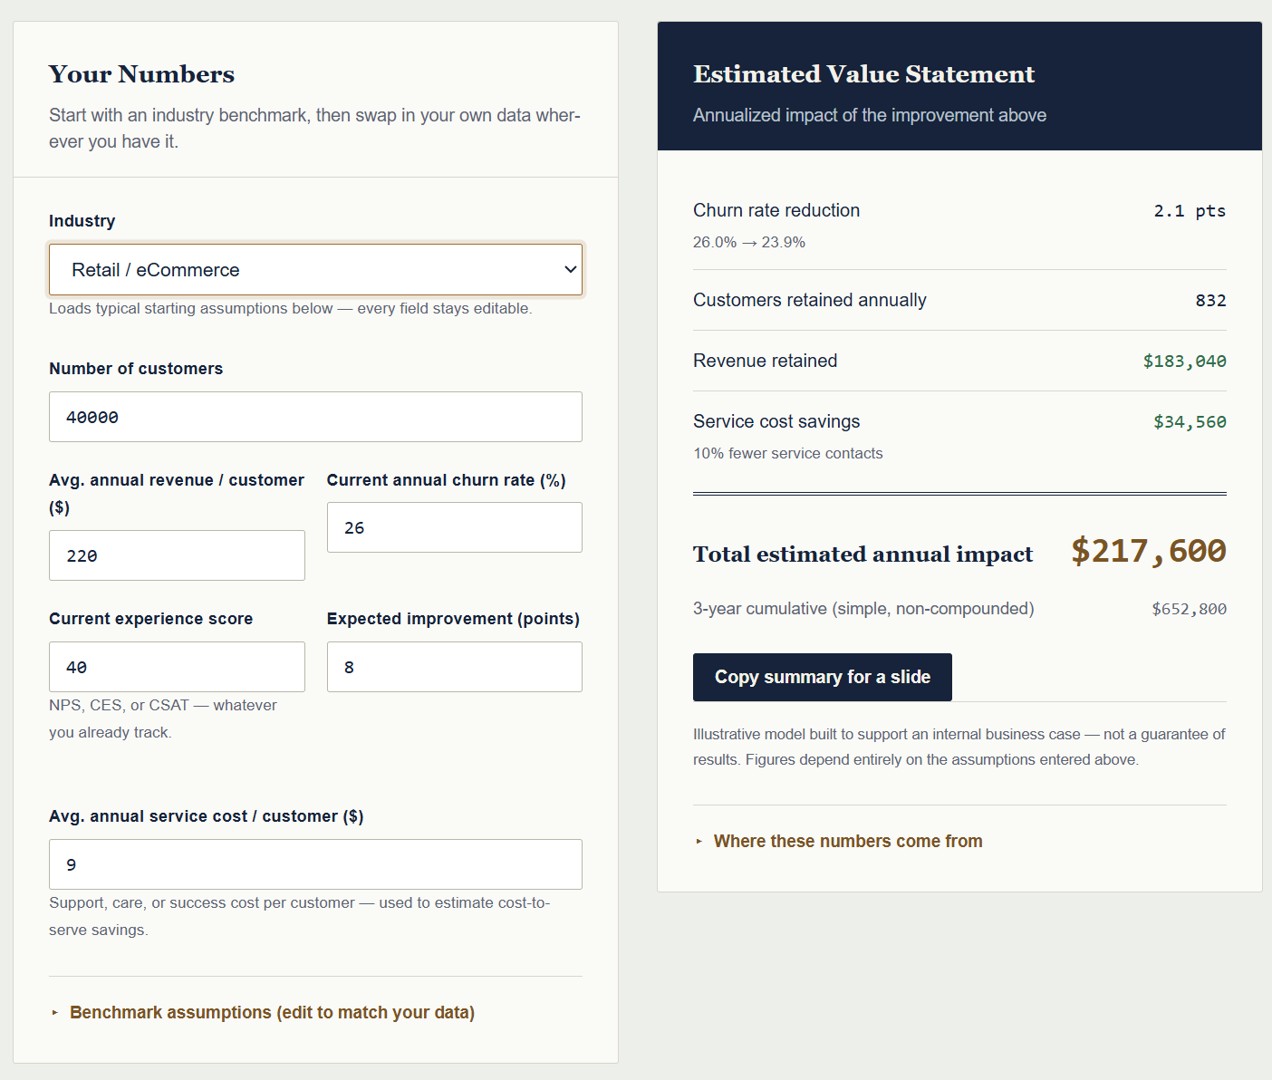
If you want a working surface for the first two methods — retained revenue and cost-to-serve — I built a free Customer Experience ROI Calculator so the value does not have to stay fuzzy. For the backup a finance partner will actually interrogate, the CX ROI Benchmark Report collects sources and the objections I hear in the room. Neither tool replaces judgment. Both beat a borrowed hockey-stick.
A score asks for belief. A priced human outcome asks for a line item. Calculate the second, and customer experience stops competing as charity. It competes as strategy — in the language enterprises already use to decide.
Frequently Asked Questions
How do you calculate CX ROI?
Calculate CX ROI by linking an experience metric to a customer or employee behavior, pricing that behavior with your own economics, and attaching the dollars to a named intervention on a specific journey. Common methods include avoided churn, repeat-contact cost, effort as cost-to-serve, expansion lift, referral as avoided CAC, and frontline replacement cost. Show a range, not a single heroic number.
Why do CX business cases fail with CFOs?
They fail when they ask finance to translate a score or an industry loyalty study into money. CFOs fund behaviors they can interrogate — retained revenue, lower cost-to-serve, avoided acquisition cost — tied to an action someone owns. Hope-based slideware cites research, shows a hockey-stick, and never names the journey or the math.
Is NPS enough to prove customer experience ROI?
No. NPS and other experience scores are signals, not a business case. They become useful for ROI only when you connect movement in the score to a behavior — renew, expand, refer, call again, or leave — and price that behavior with your churn, revenue per customer, and contact costs.
What data do you need to quantify customer experience?
Start with internal numbers: customers on the journey, churn or non-renew rate, revenue or margin per customer, fully loaded cost per contact, volume of repeat work, attach or expansion rates, CAC or contribution margin, and regrettable attrition plus replacement cost. Industry benchmarks are starter kits. Your ledger is the case.
How do you avoid fake precision in a CX business case?
Separate known facts (today’s costs and rates) from modeled assumptions (how much a fix will move behavior). Show conservative, expected, and optimistic scenarios. Pick one intervention, instrument a baseline, and set a review date. A single heroic ROI figure with false decimal places is still hope wearing a spreadsheet.
Content Authenticity Statement: The topic area, key elements to focus on, etc. were decisions made by Braden Kelley, with a little help from Google Gemini and Cursor to clean up the article, add images and create infographics.
Image credits: Pixabay
 Sign up here to get Human-Centered Change & Innovation Weekly delivered to your inbox every week.