At the beginning of each month, we will profile the ten articles from the previous month that generated the most traffic to Human-Centered Change & Innovation. Did your favorite make the cut?
But enough delay, here are July’s ten most popular innovation posts:
If you’re not familiar with Human-Centered Change & Innovation, we publish 4-7 new articles every week built around innovation and transformation insights from our roster of contributing authors and ad hoc submissions from community members. Get the articles right in your Facebook, Twitter or Linkedin feeds too!
Have something to contribute?
Human-Centered Change & Innovation is open to contributions from any and all innovation and transformation professionals out there (practitioners, professors, researchers, consultants, authors, etc.) who have valuable human-centered change and innovation insights to share with everyone for the greater good. If you’d like to contribute, please contact me.
P.S. Here are our Top 40 Innovation Bloggers lists from the last five years:
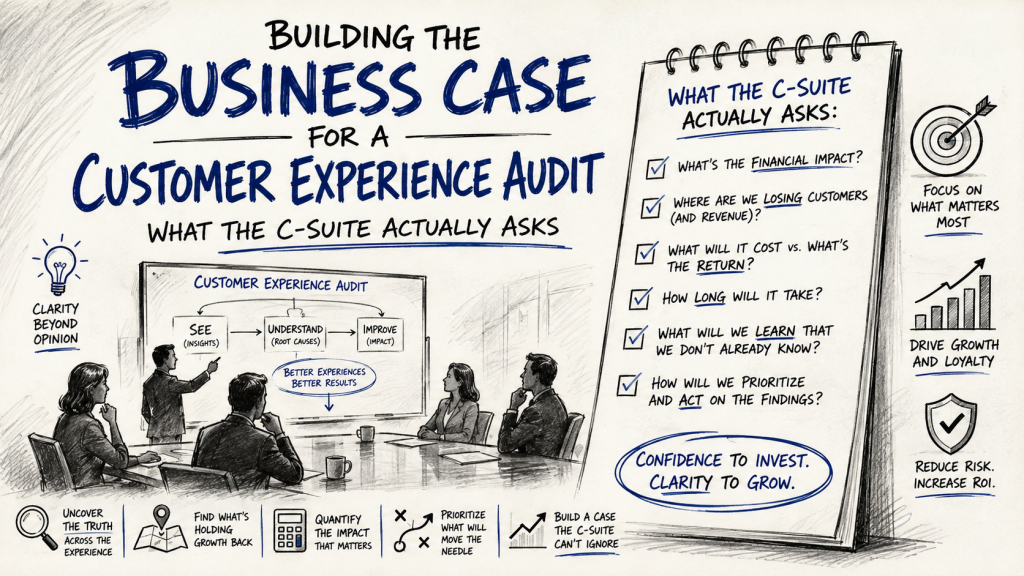
Every Customer Experience (CX) leader I’ve worked with believes, correctly, that their organization needs a customer experience audit. Very few of them get the budget approved on the first try. The gap almost never comes down to whether the need is real — it comes down to whether the person championing it walked into the room prepared for the four questions a C-suite reliably asks, in roughly this order.
“What does this cost us if we do nothing?”
This is the opening question, and it’s the one the CX ROI Calculator exists to answer. Walk in with your own churn rate, revenue per customer, and a modeled range — conservative to optimistic — rather than an industry statistic borrowed from a research report. A number that’s obviously yours survives scrutiny. A number that’s obviously generic invites the room to argue with the source instead of the substance.
“Why an audit, and not just another survey?”
This is where most business cases quietly fall apart, because the honest answer requires admitting a limitation of what you’re already doing. Your NPS and CSAT programs measure what customers are willing to tell you. An audit measures what’s actually happening in the journey, including the parts customers work around instead of reporting. If your organization has been running satisfaction surveys for years and CX metrics still haven’t moved the way they should, that’s not evidence the audit is unnecessary — it’s usually the single best evidence that it is. Surveys have had their chance to find the problem. They haven’t. A different method is the correct next step, not a redundant one.
“What will we actually be able to do differently afterward?”
An executive approving a budget is not funding a diagnosis for its own sake — they’re funding the decisions the diagnosis will enable. The strongest version of this answer is specific: an audit produces a prioritized list of friction points ranked by business impact, not a general health score. Walk in already able to name the kind of decision it unlocks — “we’ll know whether to fix onboarding or billing first” is a far stronger sentence than “we’ll understand our customers better.”
“How disruptive is this, and how long until we see something?”
This is the question that kills otherwise-approved initiatives at the last step, usually because nobody addressed it until it was asked live in the room. Have the realistic timeline ready before you’re asked for it, not after: when the audit starts, what it requires from internal teams, and when the first findings arrive. Vagueness here reads as risk, even when the actual answer would have been reassuring.
Sequencing the case correctly
The order matters as much as the content. Lead with the cost of inaction (the number), and the room is primed to hear the diagnosis as the obvious next step rather than an added expense. Lead with the audit itself, and you’re immediately negotiating from a weaker position — explaining a cost before anyone in the room has agreed there’s a problem worth solving.
If you haven’t run your own numbers yet, start with the calculator — it’s the fastest way to walk into that first conversation with your own defensible figure instead of someone else’s. When you’re ready to talk about what an audit specifically finds and how it runs, the audit page has the detail, and I’m glad to answer the disruption and timeline questions directly if you’d rather hear them from me before you’re asked them by your own leadership.
Image Credit: Gemini, ChatGPT
Content Authenticity Statement: The topic area, key elements to focus on, etc. were decisions made by Braden Kelley, with a little help from Claude to clean up the article.
Sign up here to get Human-Centered Change & Innovation Weekly delivered to your inbox every week.
Most executive teams already believe that customer experience (CX) matters. Almost none of them can say, in dollars, what a specific improvement found in a Customer Experience Audit is worth — and that gap is usually the real reason a CX investment stalls before it reaches a budget conversation. Here’s a framework for closing it, backed by the research, plus a free calculator to run the numbers on your own business.
Why “CX matters” isn’t a business case
“Customer experience drives loyalty” is true, and it convinces almost no one holding a budget. What moves a budget conversation is a specific number: this metric, moved by this much, produces this many retained customers, worth this much revenue. Most CX teams never make that translation, so the initiative competes for funding against proposals that speak fluent finance while CX speaks fluent satisfaction score.
The good news is that the translation isn’t guesswork. There’s two decades of published research connecting experience metrics to financial outcomes — the trick is applying it to your own numbers instead of citing it as an abstract principle.
The research behind the number
Bain & Company, the originator of the Net Promoter Score, has found that NPS explains roughly 20% to 60% of the variation in organic growth rates between competitors in the same market, and that the NPS leader in a given industry typically outgrows competitors by more than double. In an early, widely cited analysis, Bain found that Dell’s detractors made up about 15% of its customer base and represented roughly $68 million in lost revenue — and estimated that converting just 2% to 8% of those detractors into promoters could add approximately $167 million in annual revenue.
7 pts → ~1%NPS increase → revenue growth (London School of Economics)
A separate study from the London School of Economics found that a 7-point increase in NPS corresponds to roughly 1% revenue growth, while CustomerGauge’s research in B2B contexts found a tighter, more immediate link: a 10-point NPS increase correlating with a 3.2% increase in upsell revenue among existing accounts. Underneath all of it sits Fred Reichheld’s original retention research at Bain, which found that a 5-point improvement in customer retention increases profits by 25% to 95%, depending on the industry and business model.
The wide range in that last figure isn’t a weakness in the research — it’s the whole point. The financial return on a CX improvement depends on your margin structure, your customer lifetime value, and how much of the retained revenue is truly incremental. A generic industry number can’t answer that. Your own numbers can.
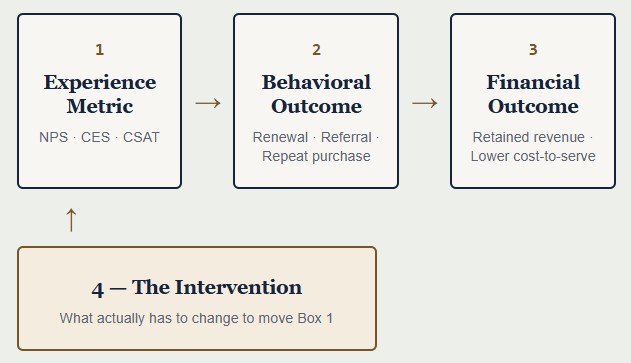
The four-step value chain
Here’s the framework that turns the research above into a number specific to your business:
Experience Metric — the number you already track: NPS, CES, or CSAT.
Behavioral Outcome — the specific customer behavior that metric predicts: renewing, referring, buying again, or churning.
Financial Outcome — that behavior’s dollar value: retained revenue, reduced cost-to-serve, lower acquisition cost.
The Intervention — what actually has to change to move Box 1 in the first place: a redesigned onboarding flow, a fixed billing process, a retrained support tier.
This is also the fastest way to diagnose why a past CX initiative didn’t show up in revenue: almost always, it moved Box 1 (the score) without a demonstrated effect on Box 2 (a specific behavior), so it was never going to reach Box 3. The fix isn’t more CX effort in general — it’s picking an intervention with a direct, traceable line to a named behavior, and measuring that behavior directly.
What “typical” looks like, by industry
Churn rates and cost-to-serve vary meaningfully by industry — and by methodology, which is worth naming honestly rather than smoothing over. Here are representative midpoints reconciled across several published benchmark studies:
Industry
Typical annual churn
Cost per service contact
SaaS / Software
5–14%
$18–$35
Retail / eCommerce
20–37%
$2.70–$12
Financial Services / Insurance
15–20%
$15–$25
Healthcare
7–9%
$50–$60
Telecom / Utilities
15–25%
$20–$30
B2B Professional Services
~10–13%
$30–$60
These are starting points for a company with no internal baseline yet — not universal constants. The strongest version of any business case replaces these with your own churn rate, revenue per customer, and service cost the moment that data exists.
Want to skip straight to your own number? Use the free CX ROI Calculator → It runs this exact framework against your own customer count, revenue per customer, and churn rate, and gives you a business-case-ready total in under two minutes.
How to build the business case, step by step
1. Start with your own numbers
Current churn rate, average revenue per customer, and cost per service contact — pulled from finance or CS systems — will always be more persuasive than an industry benchmark. Use published figures only where internal data doesn’t exist yet.
2. Separate the well-established link from your company-specific estimate
The macro relationship between experience and growth (Bain, LSE, CustomerGauge) is well documented and easy to defend by name. The precise dollar impact for your company is always a modeled estimate — say so explicitly, and the business case gains credibility rather than losing it.
3. Model conservatively, then show the range
A single point estimate invites a single objection. A modeled range — conservative, moderate, optimistic — tends to survive scrutiny far better, because it demonstrates the thinking rather than just the output.
4. Tie the number to a specific intervention
Executives fund actions, not scores. Pair the projected financial impact with the specific initiative expected to produce it, rather than presenting the improvement as if it happens on its own.
Try it on your own numbers
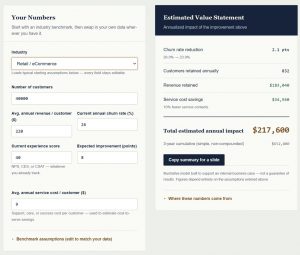
The fastest way to see this framework in action is to run it against your own business. The CX ROI Calculator uses the same four-step chain described above — enter your customer count, revenue per customer, and current churn rate (or start from an industry benchmark), and it estimates the annual revenue and cost-to-serve impact of a defined experience improvement, along with a summary you can paste straight into a slide.
Get the CX ROI Benchmark Report — the full industry benchmark table with sources, the CX Value Chain framework, and answers to the five objections a CFO is most likely to raise. Enter your email and we’ll send it straight to your inbox.
If after exploring the ROI calculator you would like to explore unlocking revenue opportunities for your business with a Customer Experience Audit, contact me directly. I’m happy to have a no-obligation conversation about whether an audit makes sense for your current situation.
Image Credit: Gemini
Content Authenticity Statement: The topic area, key elements to focus on, etc. were decisions made by Braden Kelley, with a little help from Claude to clean up the article and Gemini to add images.
Sign up here to get Human-Centered Change & Innovation Weekly delivered to your inbox every week.
 Drum roll please…
 Sign up here to get Human-Centered Change & Innovation Weekly delivered to your inbox every week.