by Braden Kelley and Art Inteligencia
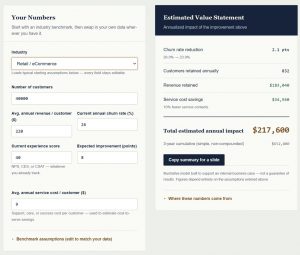
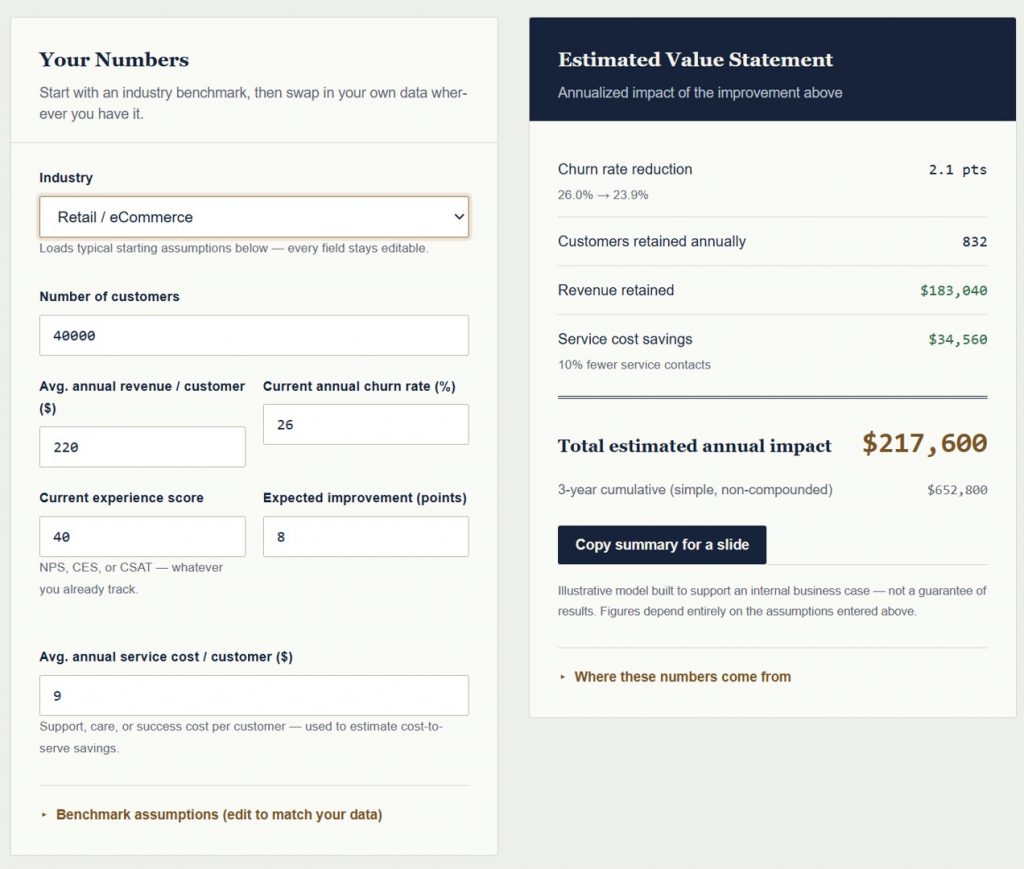
If you’ve run your numbers through the CX ROI Calculator, you already have a real, defensible number — built on your churn rate, your revenue per customer, and the same research-backed value chain I’ve written about before. That number is useful. It’s also almost certainly an undercount, and it’s worth understanding exactly why before you present it as the whole picture.
The model only sees what you’re already measuring
The four-step value chain — metric moves, behavior changes, revenue follows — is a genuinely good way to translate NPS or CSAT into dollars. But notice what it depends on: an experience metric you’re already tracking. That’s the model’s strength and its blind spot in the same breath. It can only quantify the friction that shows up in a score someone bothered to give you.
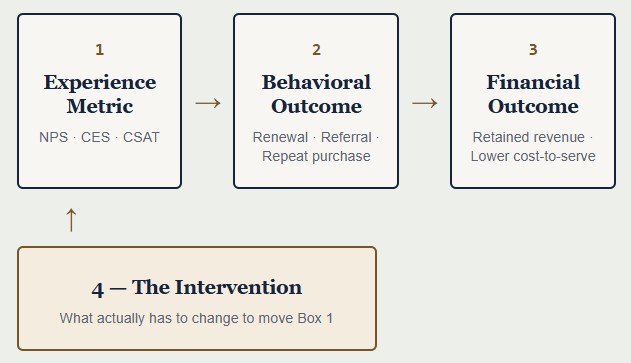
Most friction doesn’t show up in a score. It shows up nowhere, until it shows up in the renewal number six months later.
Three costs that live outside the metrics
The silent downgrade. A customer who’s frustrated rarely cancels immediately. More often, they quietly reduce usage, delay an upgrade they were considering, or let a seat go unfilled at renewal instead of adding the three they’d planned to add. None of that trips a churn alert — churn alerts fire on cancellation, not on quiet contraction. By the time it’s visible in a churn dashboard, you’re measuring the outcome of a decision the customer made months earlier, for reasons nobody on your team ever heard about.
The workaround. When something in the experience is broken, customers don’t reliably tell you — they build a workaround and keep using your product anyway. I’ve sat in on customer interviews where someone described, almost proudly, a twelve-step manual process they’d built to avoid a feature that didn’t work the way they needed. That customer will show up in your NPS survey as a “7” — not a detractor, not a promoter, just quietly tolerating a cost you don’t know exists. A workaround is a real cost to serve, it just never gets coded as a support ticket or a complaint.
The frontline save. Your support and success teams are, right now, absorbing friction on your behalf — smoothing over a confusing invoice, manually fixing what an automated process got wrong, apologizing for something they didn’t cause. Every one of those saves is a real cost (in time, in morale, in the eventual departure of your best frontline people), and every one of them is specifically designed, by the person doing it, to be invisible to leadership. That’s their job. It also means your dashboards are structurally blind to exactly the problems your best people are working hardest to hide from you.
Why this isn’t an argument against the calculator
None of this is a reason to skip the ROI modeling — a defensible number beats no number, and if you haven’t run yours yet, start there. It’s a reason to be honest about what the number represents: a floor, not a ceiling. It quantifies the experience gaps you can already see. It has no way to quantify the ones nobody’s told you about yet.
That’s the specific gap a Customer Experience Audit is built to close. Where the ROI model starts from your existing metrics and works outward, an audit starts from the actual customer journey — walked directly, not inferred from a survey response rate — and finds the workarounds, the silent downgrades, and the frontline saves before they’ve had time to show up as a number at all. (If terms like “cost to serve” or “revenue leakage” aren’t consistent vocabulary across your team yet, the Experience Design Glossary is a quick way to get everyone aligned before that conversation.)
Run the calculator first. It’ll tell you the size of the problem you already know about. The audit tells you what else is there.
Get the CX ROI Benchmark Report — the full industry benchmark table with sources, the CX Value Chain framework, and answers to the five objections a CFO is most likely to raise. Enter your email and we’ll send it straight to your inbox.
If after exploring the ROI calculator you would like to explore unlocking revenue opportunities for your business with a Customer Experience Audit, contact me directly. I’m happy to have a no-obligation conversation about whether an audit makes sense for your current situation.
Image Credit: Gemini
Content Authenticity Statement: The topic area, key elements to focus on, etc. were decisions made by Braden Kelley, with a little help from Claude to clean up the article.
 Sign up here to get Human-Centered Change & Innovation Weekly delivered to your inbox every week.