Por qué está perdiendo más de lo que cree — y ni siquiera lo sabe
ÚLTIMA ACTUALIZACIÓN: 27 de febrero de 2026 a las 6:27 PM (ENGLISH LANGUAGE VERSION)

por Braden Kelley y Art Inteligencia
I. El costo invisible de la fricción
La mayoría de las organizaciones miden los ingresos. Algunas miden las ganancias. Un número creciente mide la satisfacción del cliente. Pero muy pocas miden el ingreso en riesgo — y casi ninguna mide sistemáticamente la fuga de ingresos impulsada por la experiencia.
La cruda realidad es esta: lo que los clientes experimentan hoy determina lo que las finanzas reportan mañana. La fricción en el trayecto del cliente rara vez aparece de inmediato en un balance general. En cambio, se acumula silenciosamente: en la vacilación, en la duda, en las transacciones abandonadas, en los problemas no resueltos y en la erosión de la confianza.
Cada flujo de incorporación (onboarding) confuso. Cada política que tiene sentido internamente pero frustra externamente. Cada momento en que un cliente tiene que esforzarse más de lo esperado. Estas no son inconveniencias menores. Son micro-retiros del crecimiento futuro.
Cuando la fricción se agrava, se convierte en una fuga invisible:
- Los clientes compran menos de lo que pretendían.
- Los clientes retrasan sus decisiones.
- Los clientes exploran silenciosamente otras alternativas.
- Los clientes se van sin quejarse.
Debido a que los tableros tradicionales se centran en indicadores retrospectivos, los líderes a menudo pierden las señales de advertencia temprana. Para cuando el abandono (churn) aumenta o los márgenes se comprimen, el daño a la experiencia ya está hecho.
La experiencia del cliente no es una disciplina “blanda”. Es un indicador principal del desempeño financiero. Si no está midiendo la fricción financieramente, la está tolerando culturalmente.
El primer paso hacia el crecimiento sostenible es reconocer una realidad simple pero incómoda: lo que no puede ver ya le está costando dinero.
II. ¿Qué es un Diagnóstico de Riesgo de Experiencia del Cliente y Fuga de Ingresos?
Un Diagnóstico de Riesgo de Experiencia del Cliente y Fuga de Ingresos es una evaluación estructurada y multifuncional diseñada para descubrir dónde su organización está creando fricción involuntariamente, erosionando la confianza y poniendo en riesgo los ingresos futuros.
No es una encuesta de satisfacción. No es un estudio de percepción de marca. Y no es un taller único de mapeo del trayecto del cliente.
Es un instrumento estratégico que conecta la experiencia del cliente directamente con el rendimiento financiero.
En su esencia, el diagnóstico está diseñado para:
- Identificar la fricción en todo el trayecto de extremo a extremo del cliente
Desde el reconocimiento y la incorporación hasta el servicio y la renovación, revela dónde los clientes dudan, luchan o se desconectan. - Cuantificar el impacto financiero de las fallas en la experiencia
Traduce los momentos de frustración en exposición de ingresos medible, distorsión del costo de servicio y erosión del valor de vida del cliente (LTV). - Priorizar mejoras basadas en el riesgo y el potencial de recuperación
Permite a la dirección centrarse en intervenciones que reduzcan el riesgo, restauren la confianza y liberen el crecimiento estancado.
A diferencia de las métricas tradicionales de CX que le dicen qué sucedió, este diagnóstico le ayuda a entender por qué sucedió — y cuánto le está costando.
Al integrar datos operativos, retroalimentación de clientes, conocimientos de empleados y modelado financiero, la organización obtiene una visión clara de:
- Dónde se están filtrando silenciosamente los ingresos
- Dónde se está debilitando la confianza
- Dónde la complejidad interna surge como dolor externo
- Dónde los competidores están ganando ventaja a través de la simplicidad
En resumen, un Diagnóstico de Riesgo de Experiencia del Cliente y Fuga de Ingresos replantea la experiencia del cliente de una aspiración cualitativa a una disciplina medible de gestión de riesgos y desempeño.
III. Por qué fallan las métricas tradicionales
La mayoría de las organizaciones creen que están midiendo la experiencia del cliente de manera efectiva. Realizan un seguimiento del Net Promoter Score (NPS), la satisfacción del cliente (CSAT), las tasas de conversión, las tasas de abandono y el tiempo promedio de atención. Estas métricas son familiares. Están estandarizadas. Se reportan a la dirección con regularidad.
El problema no es que estas métricas estén equivocadas. El problema es que son incompletas — y son, en su mayoría, indicadores retrospectivos.
Le dicen qué sucedió. Rara vez le dicen por qué sucedió. Y casi nunca le dicen lo que le está costando antes de que se refleje en los ingresos.
Las tres limitaciones fundamentales
- Miden el sentimiento, no la exposición
Un cliente puede informar que está “satisfecho” mientras sigue experimentando una fricción que reduce la frecuencia de compra, el tamaño de la cesta o la lealtad a largo plazo. - Están agregadas y diluidas
Los desgloses a nivel de trayecto a menudo se ocultan dentro de los promedios de toda la empresa. Un solo punto de contacto de alta fricción puede erosionar la confianza incluso si la puntuación general parece estable. - Miran hacia atrás
Para cuando aumenta el abandono o disminuyen las recomendaciones, el daño a la experiencia ya se ha agravado. La dirección está reaccionando a los síntomas, no previniendo las causas.
Lo más importante es que las métricas tradicionales rara vez conectan las fallas de experiencia directamente con el riesgo financiero. Sin esa conexión, la fricción se normaliza.
La medición moldea el comportamiento. Si no mide la fricción en términos financieros, envía involuntariamente la señal de que es tolerable.
Un Diagnóstico de Riesgo de Experiencia del Cliente y Fuga de Ingresos cambia el enfoque de “¿Cómo estamos puntuando?” a una pregunta mucho más estratégica:
“¿Dónde estamos poniendo en riesgo involuntariamente los ingresos futuros?”
Ese replanteamiento cambia la conversación: de informar sobre resultados a prevenir pérdidas y desbloquear el crecimiento.
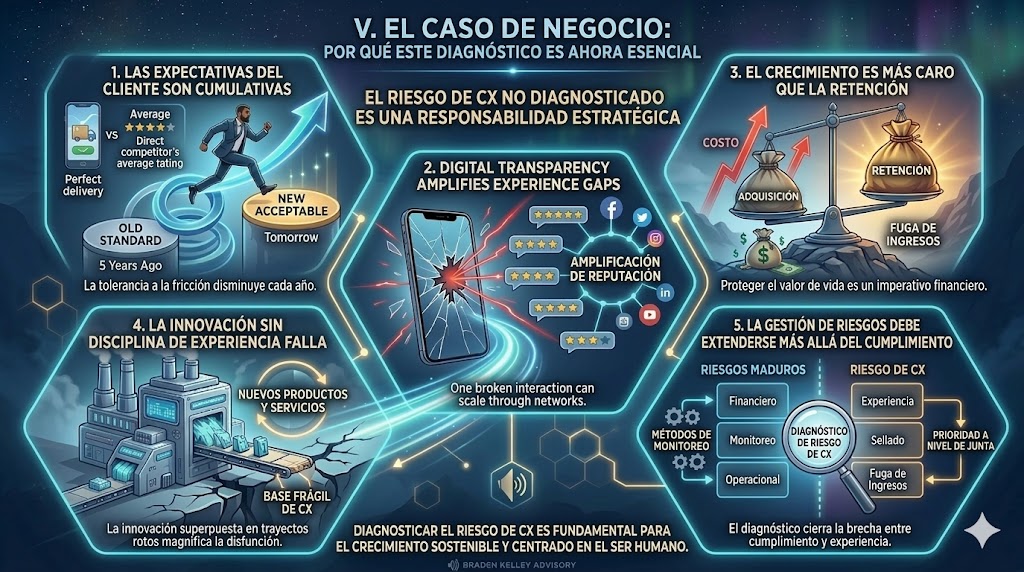
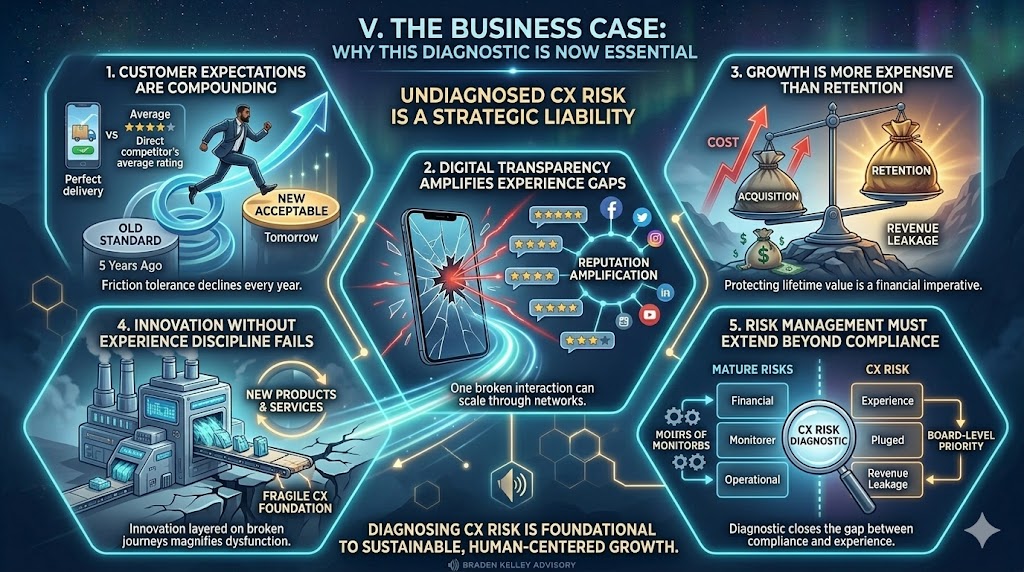
V. El caso de negocio: Por qué este diagnóstico es ahora esencial
La pregunta ya no es si la experiencia del cliente importa. La pregunta es si puede permitirse dejarla sin diagnosticar.
La dinámica del mercado ha cambiado. Las expectativas se han acelerado. La transparencia ha aumentado. Los costos de adquisición siguen subiendo. En este entorno, el riesgo de experiencia no gestionado es un pasivo estratégico.
1. Las expectativas del cliente se están acumulando
Los clientes no lo comparan solo con sus competidores directos. Lo comparan con la mejor experiencia que han tenido en cualquier lugar. La tolerancia a la fricción disminuye cada año.
Lo que parecía “aceptable” hace cinco años, ahora parece anticuado. Lo que parece ligeramente inconveniente hoy, será inaceptable mañana.
2. La transparencia digital amplifica las brechas de experiencia
Una interacción fallida puede escalar rápidamente a través de reseñas, redes sociales y redes de pares.
La inconsistencia en la experiencia ya no está contenida. La reputación se mueve a la velocidad de la visibilidad.
3. El crecimiento es más caro que la retención
Los costos de adquisición de clientes siguen aumentando en todos los sectores. Cuando los ingresos se filtran por fricciones evitables, las organizaciones se ven obligadas a gastar más solo para mantenerse en el mismo lugar.
Proteger y expandir el valor de vida del cliente es ahora un imperativo financiero, no una aspiración de marketing.
4. La innovación sin disciplina de experiencia falla
Las organizaciones invierten fuertemente en nuevos productos, servicios y tecnologías. Pero la innovación aplicada sobre trayectos defectuosos simplemente magnifica la disfunción.
La escala amplifica cualquier sistema que se tenga, sea bueno o malo. Si la base de la experiencia es frágil, las iniciativas de crecimiento expondrán las grietas.
5. La gestión de riesgos debe extenderse más allá del cumplimiento
La mayoría de las empresas cuentan con marcos de riesgo financiero y operativo maduros. Pocas aplican un rigor equivalente al riesgo de la experiencia del cliente.
Un Diagnóstico de Riesgo de Experiencia del Cliente y Fuga de Ingresos cierra esa brecha, elevando la experiencia de ser una preocupación funcional a una prioridad de gestión de riesgos y desempeño a nivel de junta directiva.
En el entorno actual, diagnosticar el riesgo de experiencia no es opcional. Es fundamental para un crecimiento sostenible y centrado en el ser humano.
VI. Qué mide realmente un diagnóstico de alto impacto
Si va a tratar la experiencia del cliente como una disciplina de crecimiento y riesgo, debe medirla con el mismo rigor que aplica al desempeño financiero. Un Diagnóstico de Riesgo de Experiencia del Cliente y Fuga de Ingresos de alto impacto va mucho más allá de las puntuaciones de sentimiento.
Evalúa la exposición, las causas raíz y las implicaciones financieras en todo el ciclo de vida del cliente.
A. Exposición al riesgo a nivel de trayecto
El diagnóstico identifica dónde los clientes dudan, luchan o se desconectan en etapas clave del trayecto.
- Patrones de caída y abandono
- Retrasos en el tiempo de ciclo
- Tasas de escalada y contacto repetido
- Transiciones inconsistentes entre canales
En lugar de mirar los promedios, aísla puntos de contacto específicos de alto riesgo donde la fricción se agrava y los ingresos se vuelven vulnerables.
B. Puntos de fricción emocional
No todo el riesgo es operativo. Algunas de las fugas más costosas comienzan a nivel emocional.
- Momentos de incertidumbre o confusión
- Momentos de percepción de injusticia
- Momentos donde se pone a prueba la confianza
- Momentos en los que los clientes se sienten ignorados
La fricción emocional reduce la confianza, y una menor confianza disminuye el compromiso, la expansión y la recomendación.
C. Causas raíz operativas
Los diagnósticos de alto impacto no se quedan en los síntomas. Rastrean la fricción hasta sus impulsores sistémicos.
- Restricciones impulsadas por políticas
- Brechas en la integración tecnológica
- Datos y derechos de decisión aislados
- Incentivos y métricas de desempeño desalineados
La complejidad interna inevitablemente surge como dolor externo para el cliente. Las soluciones sostenibles requieren una visión estructural.
D. Modelado de impacto financiero
El componente más crítico es la cuantificación. La fricción debe traducirse a términos financieros.
- Ingresos en riesgo por etapa del trayecto
- Erosión del valor de vida del cliente
- Inflación del costo de servicio
- Compresión del margen impulsada por la recuperación del servicio
Cuando las fallas de experiencia se expresan en dinero, la priorización se vuelve más clara y la alineación se acelera.
Un diagnóstico de alto impacto hace visible lo invisible, no solo emocionalmente, sino económicamente.
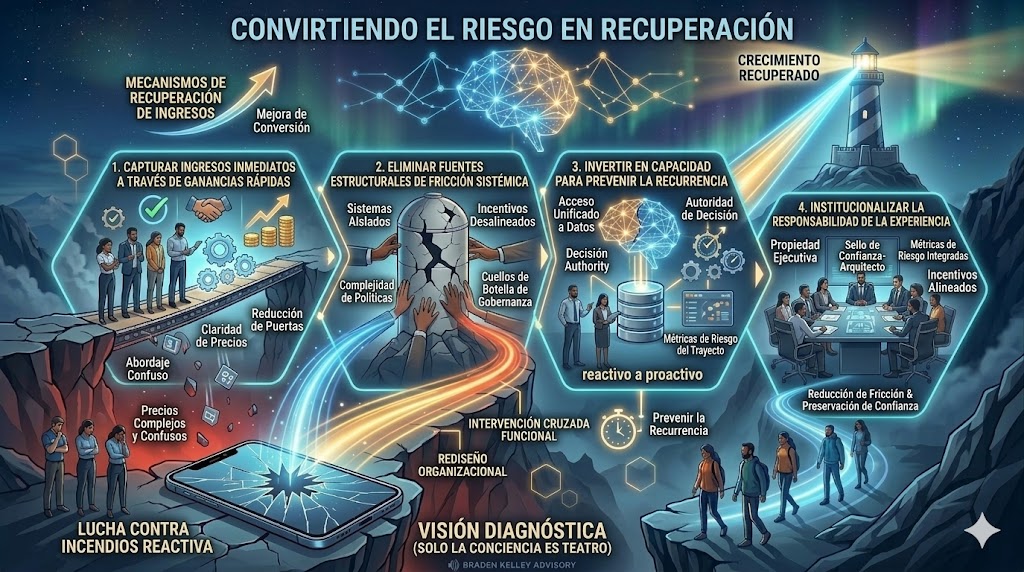
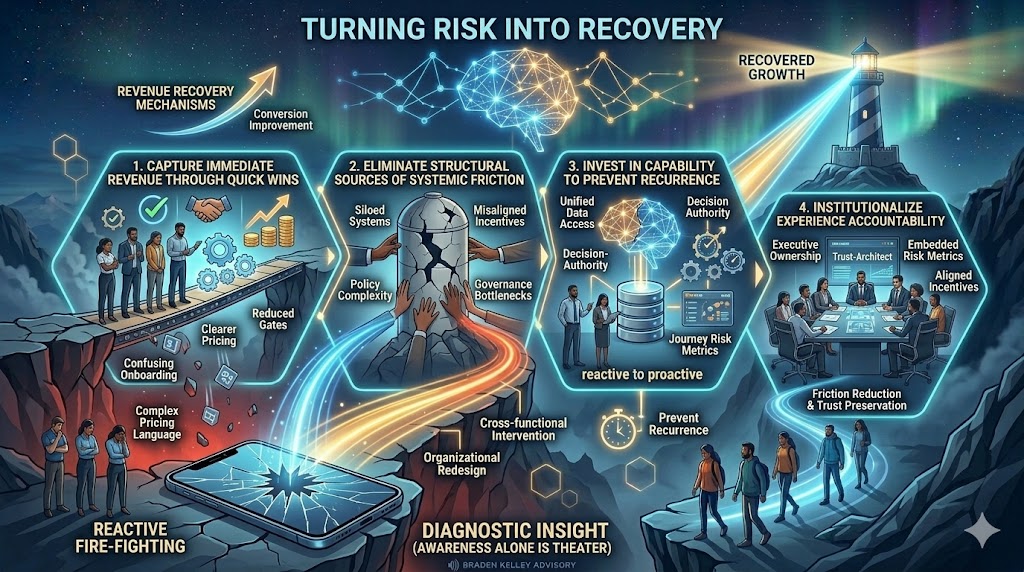
VII. De la visión a la acción: convirtiendo el riesgo en recuperación
Un diagnóstico sin activación es puro teatro.
El conocimiento por sí solo no recupera ingresos. La conciencia por sí sola no restaura la confianza. Si los hallazgos de un Diagnóstico de Riesgo de Experiencia del Cliente y Fuga de Ingresos no cambian el comportamiento, la estructura y las decisiones de inversión, entonces la organización simplemente ha producido un informe más sofisticado.
El objetivo no es el entendimiento. El objetivo es la recuperación.
1. Capturar ingresos inmediatos a través de victorias rápidas
Cada diagnóstico saca a la superficie puntos de fricción que pueden resolverse rápidamente:
- Simplificar pasos de incorporación confusos
- Aclarar el lenguaje de los precios
- Reducir filtros de aprobación redundantes
- Corregir puntos de falla de soporte de alto volumen
Estas no son mejoras cosméticas. Son mecanismos de recuperación de ingresos. Cuando la fricción disminuye, la conversión mejora. Cuando la claridad aumenta, la vacilación disminuye. Las victorias tempranas crean impulso organizacional y demuestran que la disciplina de experiencia impulsa resultados financieros.
2. Eliminar fuentes estructurales de fricción sistémica
Algunas fugas no son tácticas. Son arquitectónicas.
Sistemas aislados. Incentivos desalineados. Complejidad impulsada por políticas. Cuellos de botella en la gobernanza.
Estos requieren intervención multifuncional. Aquí es donde importa el valor del liderazgo. Porque la fricción estructural generalmente no es propiedad de nadie y es tolerada por todos.
La verdadera recuperación exige rediseñar cómo trabaja la organización, no solo cómo se ve el trayecto del cliente.
3. Invertir en capacidad para prevenir la recurrencia
Las fallas de experiencia a menudo se remontan a brechas de capacidad:
- Empleados de primera línea sin autoridad para decidir
- Equipos sin acceso a datos unificados de clientes
- Líderes sin visibilidad de las métricas de riesgo a nivel de trayecto
Si la organización no puede detectar la fricción a tiempo, seguirá perdiendo ingresos silenciosamente. La inversión en capacidad convierte la extinción reactiva de incendios en una orquestación proactiva.
4. Institucionalizar la responsabilidad de la experiencia
El cambio duradero requiere gobernanza.
Eso significa:
- Asignar la propiedad ejecutiva de la salud del trayecto
- Integrar métricas de riesgo de experiencia en los tableros de desempeño
- Alinear los incentivos con la reducción de la fricción y la preservación de la confianza
La medición moldea el comportamiento. Cuando el riesgo de experiencia se mide financieramente, deja de ser una preocupación “blanda” y se convierte en una prioridad de la junta directiva.
El Cambio
Cuando las organizaciones pasan de la visión a la acción, la narrativa cambia.
No estamos mejorando la satisfacción del cliente.
Estamos recuperando el crecimiento.
Estamos protegiendo el margen.
Estamos fortaleciendo la confianza.
Un Diagnóstico de Riesgo de Experiencia del Cliente y Fuga de Ingresos no es la meta. Es el punto de ignición. Lo que importa es lo que la organización haga después: qué tan rápido actúe, qué tan audazmente rediseñe y qué tan profundamente se comprometa con la rendición de cuentas centrada en el ser humano.
Porque la fricción se acumula.
Pero también lo hace la recuperación disciplinada.
VIII. El impacto cultural
Realizar un Diagnóstico de Riesgo de Experiencia del Cliente y Fuga de Ingresos no se trata solo de números y tableros. Es un catalizador para la transformación cultural.
Cuando una organización cuantifica el riesgo de experiencia, envía una señal clara: los resultados del cliente son inseparables del desempeño del negocio.
Cambios culturales clave
- Las finanzas prestan atención: La fuga de ingresos es ahora medible y visible, lo que la convierte en una preocupación de la junta directiva en lugar de una noción abstracta.
- Las operaciones se involucran: Los equipos de primera línea ven cómo sus acciones influyen directamente en los resultados financieros, motivando la resolución proactiva de problemas.
- El liderazgo prioriza: La planificación estratégica incorpora el riesgo de experiencia como una dimensión clave junto con los objetivos de costo, eficiencia y crecimiento.
- Los empleados ganan claridad: Todos entienden cómo las decisiones del día a día impactan en la confianza del cliente, la lealtad y los ingresos.
La conversación cambia de:
“¿Qué tan satisfechos están nuestros clientes?”
A una pregunta más estratégica y procesable:
“¿Cuánto crecimiento estamos dejando sobre la mesa?”
Este cambio cultural integra la responsabilidad por la experiencia en todos los niveles de la organización. Mueve la experiencia del cliente de ser una iniciativa departamental a ser una disciplina de desempeño en toda la empresa.
En última instancia, las organizaciones que adoptan esta mentalidad son más ágiles, más resilientes y más capaces de mantener un crecimiento rentable.
IX. El imperativo del liderazgo
El cambio centrado en el ser humano comienza con líderes que están dispuestos a ver la realidad con claridad. Un Diagnóstico de Riesgo de Experiencia del Cliente y Fuga de Ingresos proporciona el lente para identificar la fricción oculta, cuantificar su impacto y priorizar la acción.
El liderazgo no puede permitirse confiar en suposiciones, comentarios anecdóticos o métricas retrospectivas. El futuro del crecimiento está determinado por qué tan bien la organización previene las fugas antes de que aparezcan en el balance general.
Principios fundamentales para líderes
- Ver la realidad con claridad: Reconocer que la fricción y la erosión de la confianza son amenazas reales y medibles para los ingresos y la lealtad.
- Medir lo que realmente importa: Ir más allá de las métricas de NPS, CSAT y abandono. Cuantificar el ingreso en riesgo y el impacto financiero de las fallas de experiencia.
- Actuar proactivamente: Usar los conocimientos del diagnóstico para guiar intervenciones inmediatas, mejoras estructurales y desarrollo de capacidades.
- Integrar la responsabilidad: Hacer que el riesgo de experiencia sea una responsabilidad compartida entre funciones, no una iniciativa aislada.
Un diagnóstico sin activación del liderazgo es solo un informe. El verdadero impacto llega cuando los conocimientos se operacionalizan, convirtiendo el riesgo en recuperación y la fricción en oportunidad.
En última instancia, los líderes que adoptan este enfoque cambian la conversación organizacional de:
“¿Estamos ofreciendo buenas experiencias?”
A una pregunta más estratégica y urgente:
“¿Dónde estamos poniendo en riesgo involuntariamente los ingresos futuros y cómo lo solucionamos?”
Este es el imperativo del liderazgo: ver, medir, actuar e integrar una cultura donde la experiencia del cliente impulse el crecimiento sostenible.
X. Reflexión final
La innovación no falla porque las ideas sean débiles. Falla porque el sistema de experiencia no puede sostenerlas. Un producto, servicio o solución brillante no puede prosperar si la fricción, las brechas de confianza o las limitaciones operativas bloquean su camino hacia el cliente.
Si desea un crecimiento sostenible, tres imperativos son claros:
- Deje de adivinar: Descubra la fricción oculta y la fuga de ingresos antes de que escale.
- Deje de confiar en indicadores retrospectivos: Las métricas tradicionales por sí solas no revelarán los riesgos silenciosos que socavan el crecimiento.
- Diagnostique, cuantifique y actúe: Traduzca los conocimientos en intervenciones inmediatas, correcciones estructurales e inversiones en capacidad.
Porque lo que no puede ver eventualmente aparecerá: en el abandono, en la compresión de márgenes y en la pérdida de relevancia. Esperar hasta que aparezca en los estados financieros es demasiado tarde.
Un Diagnóstico de Riesgo de Experiencia del Cliente y Fuga de Ingresos otorga a las organizaciones la claridad, el rigor y la previsión necesarios para proteger los ingresos, fortalecer la confianza y permitir que la innovación escale con éxito.
Al final, el diagnóstico no es solo una herramienta. Es una mentalidad estratégica: medir lo que importa, ver la realidad y actuar con decisión. Aquellos que lo adopten no solo sobrevivirán a la disrupción, sino que prosperarán en ella.
Preguntas frecuentes: Diagnóstico de Riesgo de Experiencia del Cliente y Fuga de Ingresos
1. ¿Qué es exactamente un Diagnóstico de Riesgo de Experiencia del Cliente y Fuga de Ingresos?
Es una evaluación estructurada que identifica puntos de fricción a lo largo del trayecto del cliente, mide el impacto financiero de las fallas de experiencia y prioriza acciones para reducir el riesgo y recuperar los ingresos perdidos. A diferencia de las encuestas tradicionales, conecta la experiencia del cliente directamente con resultados comerciales medibles.
2. ¿En qué se diferencia este diagnóstico de las métricas tradicionales de CX como NPS o CSAT?
Las métricas tradicionales son indicadores retrospectivos que informan sobre lo que ya sucedió. Un diagnóstico profundiza al descubrir fuentes ocultas de fricción y erosión de la confianza, cuantificando el ingreso en riesgo y vinculando los puntos de contacto operativos y emocionales con consecuencias financieras tangibles. Transforma la CX de una medida cualitativa en una herramienta estratégica de riesgo y crecimiento.
3. ¿Quién se beneficia de este diagnóstico dentro de la organización?
Todos se benefician, desde el liderazgo hasta los empleados de primera línea. Los líderes obtienen visibilidad sobre el riesgo y la oportunidad financiera, los equipos de operaciones entienden dónde centrar las mejoras y los empleados ven cómo las acciones diarias impactan la confianza del cliente y los ingresos. Alinea a toda la organización en torno a resultados de experiencia medibles.
Créditos de imagen: ChatGPT, Google Gemini (click here for the English version)
Declaración de autenticidad del contenido: El área temática, los elementos clave en los que centrarse, etc., fueron decisiones tomadas por Braden Kelley, con una pequeña ayuda de ChatGPT para limpiar el artículo y añadir citas.
![]() Regístrese aquí para recibir semanalmente en su bandeja de entrada el boletín Human-Centered Change & Innovation.
Regístrese aquí para recibir semanalmente en su bandeja de entrada el boletín Human-Centered Change & Innovation.
 Drum roll please…