 This article is the second in a series of four articles digging into the recently released Global Innovation Index 2011 put together by Insead along with knowledge partners Alcatel-Lucent, Booz & Co., the Confederation of Indian Industry (CII), and the World Intellectual Property Organization (WIPO).
There is a lot of data in the Global Innovation Index 2011 and so I thought it would share it with you bit by bit to make it digestible and then share my overall thoughts. In the first article we shared the overall Global Innovation Index 2011 country rankings. These overall rankings are based on two main components – innovation inputs and innovation outputs.
Below you’ll find the country rankings based on innovation inputs and the country ranking based on innovation outputs.
The source data for creating the innovation inputs rankings includes:
1. Institutions
1.1 Political environment
– 1.1.1 Political stability
– 1.1.2 Government effectiveness
– 1.1.3 Press freedom
1.2 Regulatory Environment
– 1.2.1 Regulatory quality
– 1.2.2 Rule of law
– 1.2.3 Rigidity of employment
1.3 Business Environment
– 1.3.1 Time to start a business, days
– 1.3.2 Cost to start a business, % income/cap
– 1.3.3 Total tax rate, % profits
2. Human Capital & Research
2.1 Education
– 2.1.1 Education expenditure, % GNI
– 2.1.2 Public expenditure/pupil, % GDP/cap
– 2.1.3 School life expectancy, years
– 2.1.4 PISA scales in reading, maths, & science
– 2.1.5 Pupil-teacher ratio, secondary
2.2 Tertiary Education
– 2.2.1 Tertiary enrollment, % gross
– 2.2.2 Graduates in science, %
– 2.2.3 Graduates in engineering, %
– 2.2.4 Tertiary inbound mobility, %
– 2.2.5 Tertiary outbound mobility, %
– 2.2.6 Gross tertiary outbound enrollment, %
2.3 Research & Development (R&D)
– 2.3.1 Researchers headcount/million pop
– 2.3.2 Gross expenditure on R&D, % GDP
– 2.3.3 Quality research institutions
3. Infrastructure
3.1 Info & Comm. Technologies (ICT)
– 3.1.1 ICT access
– 3.1.2 ICT use
– 3.1.3 Government’s Online Service
– 3.1.4 E-Participation
3.2 Energy
– 3.2.1 Electricity output, kWh/cap
– 3.2.2 Electricity consumption, kWh/capita
– 3.2.3 GDP/unit of energy use, PPP$/kg oil eq.
– 3.2.4 Share of renewables in energy use, %
3.3 General Infrastructure
– 3.3.1 Quality of trade & transport infrastructure
– 3.3.2 Gross capital formation, % GDP
– 3.3.3 Ecological footprint & biocapacity, ha/cap
4. Market Sophistication
4.1 Credit
– 4.1.1 Strength of legal rights for credit
– 4.1.2 Depth of credit information
– 4.1.3 Domestic credit to private sector, % GDP
– 4.1.4 Microfinance gross loans, % GDP
4.2 Investment
– 4.2.1 Strength of investor protection
– 4.2.2 Market capitalization, % GDP
– 4.2.3 Total value of stocks traded, % GDP
– 4.2.4 Venture capital deals/tr GDP PPP$
4.3 Trade & Competition
– 4.3.1 Applied tariff rate weighted mean, %
– 4.3.2 Market access trade restrictiveness*, %
– 4.3.3 Imports of goods & services, % GDP
– 4.3.4 Exports of goods & services, % GDP
– 4.3.5 Intensity local competition
5. Business Sophistication
5.1 Knowledge Workers
– 5.1.1 Knowledge-intensive employment, %
– 5.1.2 Firms offering formal training, % firms
– 5.1.3 R&D performed by business, %
– 5.1.4 R&D financed by business, %
5.2 Innovation Linkages
– 5.2.1 University/industry collaboration
– 5.2.2 State of cluster development
– 5.2.3 R&D financed by abroad, %
– 5.2.4 JV/strategic alliance deals/tr GDP PPP$
– 5.2.5 PCT patent filings with foreign inventor, %
5.3 Knowledge Absorption
– 5.3.1 Royalty & license fees payments, % GDP
– 5.3.2 High-tech imports less re-imports, %
– 5.3.3 Computer & comm. service imports, %
– 5.3.4 FDI net inflows, % GDP
Here are the country rankings from the Global Innovation Index 2011 based on innovation inputs:
The source data for creating the innovation outputs rankings includes:
6. Scientific Outputs
6.1 Knowledge Creation
– 6.1.1 Domestic resident patent ap/bn GDP PPP$
– 6.1.2 PCT resident patent ap/bn GDP PPP$
– 6.1.3 Domestic res utility model ap/bn GDP PPP$
– 6.1.4 Scientific & technical articles/bn GDP PPP$
6.2 Knowledge Impact
– 6.2.1 Growth rate of GDP PPP$/worker, %
– 6.2.2 New businesses/1,000 pop. 15–64 yrs
– 6.2.3 Computer software spending, % GDP
6.3 Knowledge Diffusion
– 6.3.1 Royalty & license fees receipts, % GDP
– 6.3.2 High-tech exports less re-exports, %
– 6.3.3 Computer & comm service exports, %
– 6.3.4 FDI net outflows, % GDP
7. Creative Outputs
7.1 Creative Intangibles
– 7.1.1 Domestic res trademark ap/bn GDP PPP$
– 7.1.2 Madrid resident trademark ap/bn GDP PPP$
– 7.1.3 ICT & business models
– 7.1.4 ICT & organizational models
7.2 Creative Goods & Services
– 7.2.1 Recreation & culture consumption, %
– 7.2.2 National feature films/mn pop
– 7.2.3 Daily newspapers/1,000 literate pop
– 7.2.4 Creative goods exports, %
– 7.2.5 Creative services exports, %
Here are the country rankings from the Global Innovation Index 2011 based on innovation outputs:
In future articles we will take a look at the Innovation Efficiency Index from the Global Innovation Index 2011, which compares the two, and our thoughts about the study in general.
Check back in the coming days for additional articles highlighting whatever insights I can extract from the Global Innovation Index 2011 report. Until then, feel free to sound off in the comments about whether you believe your country’s position in the innovation inputs or outputs rankings are justified or off base.
Additional Global Innovation Index 2011 Articles:
#1 – Global Innovation Index 2011 – Country Rankings
#2 – THE ARTICLE ABOVE
#3 – Coming Soon
#4 – Coming Soon
In the meantime, consider following the Human-Centered Change & Innovation page on LinkedIn.
 Sign up here to get Human-Centered Change & Innovation Weekly delivered to your inbox every week.
 Do you have a favorite innovation video?
If you’ve read all the way to the bottom, then you deserve a free sample chapter from my new book Stoking Your Innovation Bonfire. I hope you enjoy the sample chapter and consider purchasing the book as a way of supporting the future growth of this community.
 One of the things that was discussed as a possibility was having team members fill out a simple worksheet to identify what roles they believe their teammates tend towards, while also self-identifying themselves. If the whole team were to complete this exercise it should yield some interesting and actionable data.
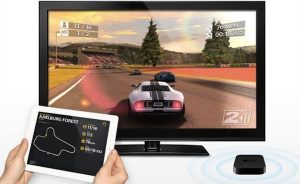 There have been several recent product announcements or launches that move a step closer to the future vision of computing that I began advocating two years ago. That vision that moves computing to the pocket, home, or office and envisions display and input devices relevant to the context the person is currently in.
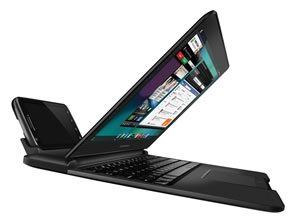 Motorola Atrix – A dockable 4G smart phone that while apparently it makes a pretty good smart phone, the lapdock that it connects to in order to give you laptop type functionality has received pretty poor reviews – making it sound like it’s not very-well designed or compelling.
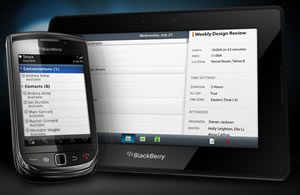 RIM Blackberry Playbook – RIM’s entry into the tablet market is the Blackberry Playbook. RIM failed to take the full leap and release an inexpensive dumb screen that connects to the user’s Blackberry. Instead it appears to be a fully functional (and priced) 7-inch tablet computer that uses the bigger screen to display the user’s email from their mobile handset without cables. RIM’s lack of commitment to the vision I’ve laid out has resulted in a ‘stuck in the middle’ device that is unlikely to catch on in the marketplace.
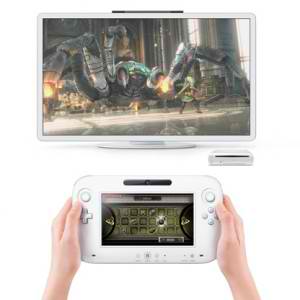 Nintendo WiiU – Nintendo is launching an oversize motion sensing controller that also has a display for game developers to utilize to extend the gaming environment out of the TV and closer to the gamer. This opens up the opportunity to either remove some of the visual visual clutter from the big screen onto the little one (creating a more immersive experience) or to leverage the second screen to deliver more game information (imagine flipping through pages of item inventories, maps, etc.). In this case the Nintendo Wii has the smarts and delivers the images wirelessly to the WiiU controller.
 Let’s examine something that has been bothering me for a little while. I’ve been renting my movies from Blockbuster and