by Braden Kelley and Art Inteligencia
Most executive teams already believe that employee experience matters. Ask them in a planning meeting and you’ll get nods all around the table. Then ask the harder question: what is a specific improvement to the employee experience worth, in dollars, next year? The nods stop.
That gap is why so many worthwhile investments in people stall in budget season. A manager development program, a fix for a broken onboarding process, a serious attempt to remove the daily friction that wears people down: each of them competes with projects that arrive with a number attached. If you can’t attach one, the project usually loses to something that can.
This article walks through how to attach one. It’s built on the same approach as my customer experience ROI calculator, applied to the people on the other side of the experience, and it comes with a free tool so you can run your own numbers.
What the research does and doesn’t say
There’s a lot of research connecting employee engagement to business results, and the best-known source is Gallup. In its comparison of top-quartile and bottom-quartile engagement teams, Gallup reports that the most engaged teams show about 23% higher profitability, 14% higher productivity and 78% less absenteeism. Turnover is 51% lower in low-turnover organizations and 21% lower in high-turnover ones.
Gallup also puts the cost of replacing an employee at one-half to two times the person’s annual salary, and reports that 52% of employees who leave voluntarily say their manager or organization could have done something to prevent it.
Those are striking numbers, and I want to be careful with them, because they’re easy to misuse. They compare very different teams, so they show a strong association, not proof that raising your own score by ten points will produce a particular result. They also aren’t per-point rates, so you can’t take “78% less absenteeism” and apply it to a modest improvement. Treat the research as evidence that the connection is real and large enough to be worth modeling, then model it with your own numbers and cautious assumptions.
The value chain: from a score to a dollar
The idea behind the calculator is a four-step chain.
- An experience metric. Engagement, eNPS, or a pulse score: whatever you already track.
- A behavioral outcome. People who have a better experience at work tend to stay longer, miss less work and contribute more.
- A financial outcome. Each of those behaviors has a dollar value: avoided replacement cost, recovered working time, more output from the same payroll.
- An intervention. The specific change that moves the metric in the first place.
The fourth step is the one people skip. Plenty of engagement initiatives improve a survey score without changing anyone’s behavior, so they never reach the financial outcome. A credible business case names the intervention, explains how it changes what people actually do, and then estimates what that behavior change is worth.
What the calculator measures
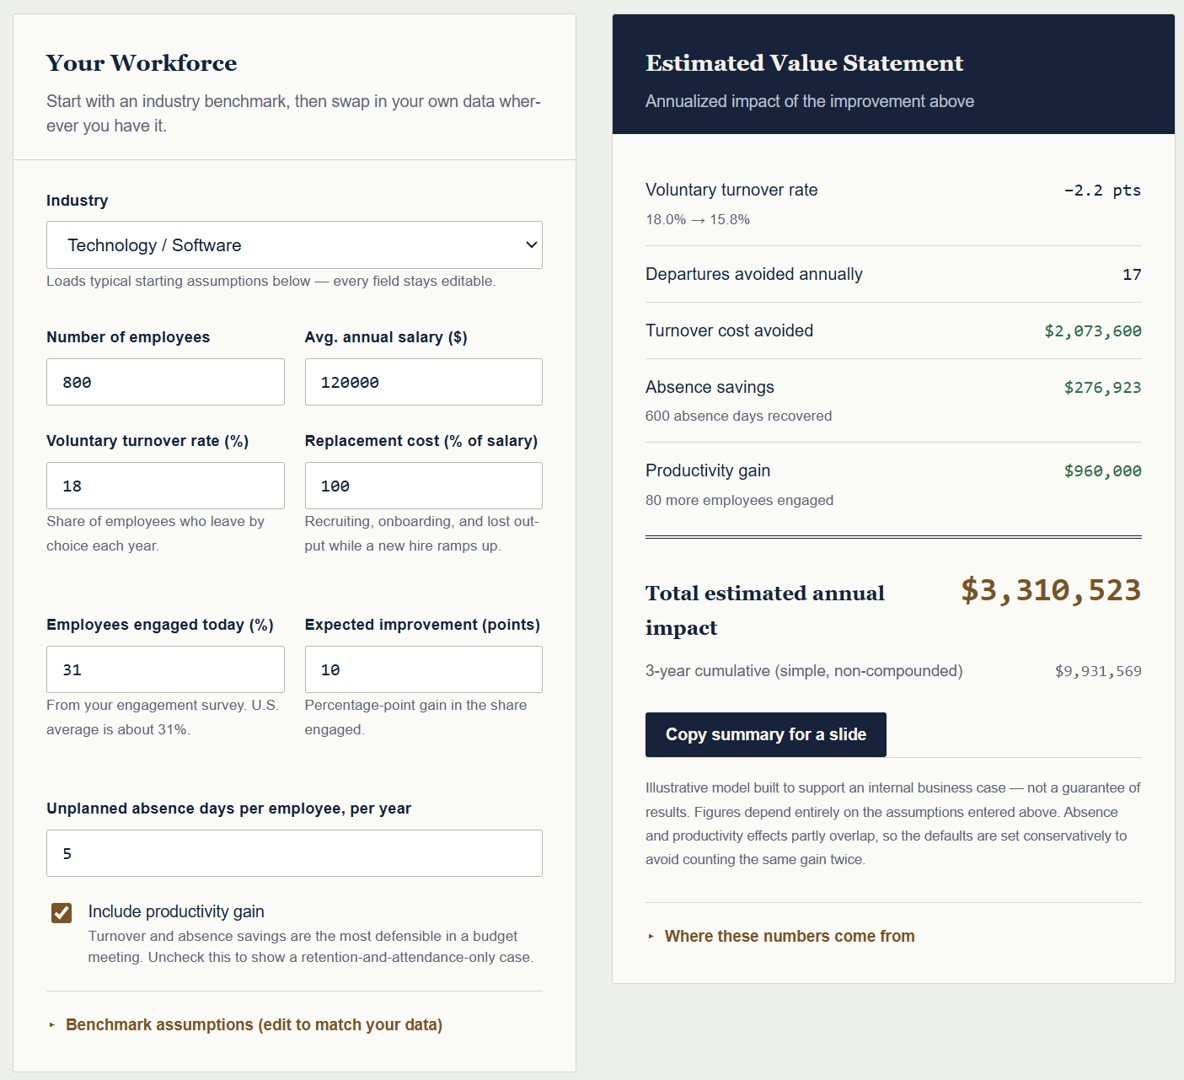
The EX Value Ledger estimates three kinds of value from an improvement in your experience score:
- Avoided turnover cost. Fewer people leave, so you pay for fewer replacements. This is usually the largest and most defensible line.
- Recovered absence time. Fewer unplanned absence days means more paid time spent working.
- Productivity value. More output from the same payroll. It’s the softest of the three, so the calculator shows it separately and leaves it out of the total unless you choose to include it.
You enter your headcount, average salary, annual turnover rate, replacement cost as a percentage of salary, absence days per employee, your current experience score and the improvement you expect. If you have a program cost, add it and the tool also shows net value and a return multiple.
Starting points when you don’t have your own data
Not everyone has clean turnover figures at their fingertips. The calculator includes three starting profiles you can load and then overwrite. These are illustrative starting points, not industry statistics:
| Profile | Annual turnover | Notes |
|---|---|---|
| Lower-turnover environment | about 12% | Stable workforce, longer tenures |
| Typical environment | about 20% | A reasonable midpoint to start from |
| High-turnover environment | about 45% | Gallup uses 40% as its line for “high-turnover” organizations |
For replacement cost, Gallup’s one-half to two times salary range is wide, and where you land depends on the role and how much knowledge walks out the door with the person. The calculator defaults to 100% of salary, so adjust it to what you know about your own hiring and ramp-up costs.
A worked example
Here’s what the tool produces with its default settings, so you can see how the pieces fit. Suppose a company has 250 employees at an average salary of $75,000, 20% annual turnover and five unplanned absence days per person. It runs a program expected to raise its experience score by ten points.
The calculator’s conservative defaults assume that a ten-point gain cuts turnover by about 5% in relative terms, so a 20% turnover rate drops to 19%. That’s roughly two and a half fewer departures a year. At a replacement cost of 100% of salary, that’s about $187,500 in avoided turnover cost. Add about $18,000 in recovered absence time, and the estimate comes to roughly $205,000 a year, or about $616,000 over three years on a simple, non-compounded basis.
The productivity line adds another estimate on top, shown separately because it’s easier for a skeptic to challenge. That’s the point: you lead with the number you can defend, and present the rest as upside.
This is an illustrative model, not a forecast. Change the inputs to match your organization, and the answer changes with them.
Turning the number into a business case
A number on its own doesn’t win a budget argument. A few habits make the difference.
Use your own figures first. The strongest estimate always starts with your real turnover rate, your real salary data and your real absence numbers. Starting profiles are for getting unstuck, not for presenting to a CFO.
Separate what’s established from what’s estimated. Be clear about which parts come from published research and which come from your own assumptions. A CFO will trust a model more when it shows where the soft spots are.
Model a range. Run a conservative case, an expected case and an optimistic one by changing the sensitivity assumptions. A range signals honesty, and it protects you if results land a bit below the middle.
Tie it to a specific initiative. “Improve employee experience” is not a project. “Redesign onboarding for the first 90 days” is. Attach the estimate to the thing you’d actually do, and say how it changes behavior.
Lead with the defensible lines. Turnover and absence are measurable and familiar to finance. Productivity is plausible but harder to prove. Present them in that order.
Where a score comes from
A calculator can tell you what a better score is worth. It can’t tell you what’s dragging yours down. That requires looking at how work actually gets done: the tools that slow people down, the approvals that add nothing, the handoffs where things fall through, and the frontline knowledge that never makes it up the chain.
That’s what an experience audit is for. It replaces internal assumptions with an accurate picture of what people really experience, and it gives you a prioritized view of where to invest first. Used together, the calculator sizes the opportunity and the audit finds the specific friction behind it.
If you’re also looking at the customer side of the equation, the CX ROI Calculator works the same way for revenue retained and cost to serve, and the two make a useful pair when you’re building the case for a broader experience investment.
Try it
The Employee Experience ROI Calculator is free and requires no signup. Enter your numbers, adjust the assumptions, and use “Copy summary for a slide” to bring the estimate straight into your next budget meeting. If you’d like the full research behind the numbers, the page also offers the EX ROI Benchmark Report by email.
And if you’d like help applying it to your organization’s specific situation, or finding out what’s actually driving your experience score, get in touch for a no-obligation conversation about an Experience Audit.
Sources
Get the EX ROI Benchmark Report — the full industry benchmark table with sources, the EX Value Chain framework, and answers to the five objections a CFO is most likely to raise. Enter your email and we’ll send it straight to your inbox.
Image Credit: Braden Kelley
Content Authenticity Statement: The topic area, key elements to focus on, etc. were decisions made by Braden Kelley, with a little help from Claude to clean up the article.
 Sign up here to get Human-Centered Change & Innovation Weekly delivered to your inbox every week.