The Hidden Experience Failures Driving Customers Away
by Braden Kelley and Art Inteligencia
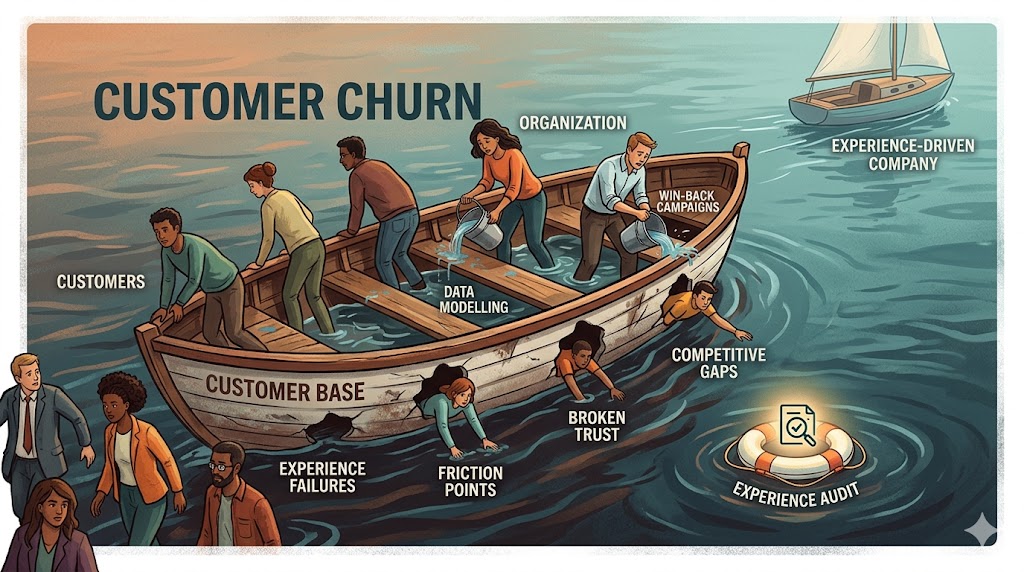
Customer churn is the most honest signal your organization receives. When customers leave, they are telling you — with their feet — that something in their experience with you fell below the threshold required to stay. Most organizations respond to churn with data: dashboards, cohort analysis, predictive models, and win-back campaigns. These tools are valuable. But they treat churn as a measurement problem when it is fundamentally an experience problem.
You cannot data-model your way out of experience failures. You have to find them, understand them, and fix them. That requires a different kind of inquiry — one that starts with the human experience, not the spreadsheet.
What is Customer Churn?
Customer churn — also called customer attrition — is the rate at which customers stop doing business with an organization over a given period. It is calculated as:
Churn Rate = (Customers Lost During Period ÷ Customers at Start of Period) × 100
A 5% monthly churn rate means you are replacing your entire customer base roughly every 20 months — just to stay flat. The business math is brutal: acquiring a new customer costs 5–25x more than retaining an existing one, and a 5% improvement in retention rate can increase profitability by 25–95% (Bain & Company / Harvard Business Review). This is why customer churn is one of the most consequential metrics in any business.
But the number alone tells you nothing about why customers are leaving — or how to stop them.
The Two Types of Customer Churn
Voluntary churn is when customers actively choose to leave — canceling subscriptions, switching to competitors, or simply stopping purchases. Voluntary churn is almost always caused by experience failures: unmet expectations, accumulated frustrations, competitive alternatives that seem better, or a specific incident that broke trust.
Involuntary churn is when customers leave for passive reasons — failed payments, expired cards, technical issues, or life circumstances. Involuntary churn is more mechanical and can be addressed through better billing infrastructure and proactive outreach. It is typically 20–40% of total churn in subscription businesses.
Most churn reduction programs focus on involuntary churn because it is easier to address with automation. Most churn value is in voluntary churn because fixing experience failures has compounding effects — it retains existing customers, reduces negative word of mouth, and improves the experience for future customers simultaneously.
The Real Causes of Customer Churn
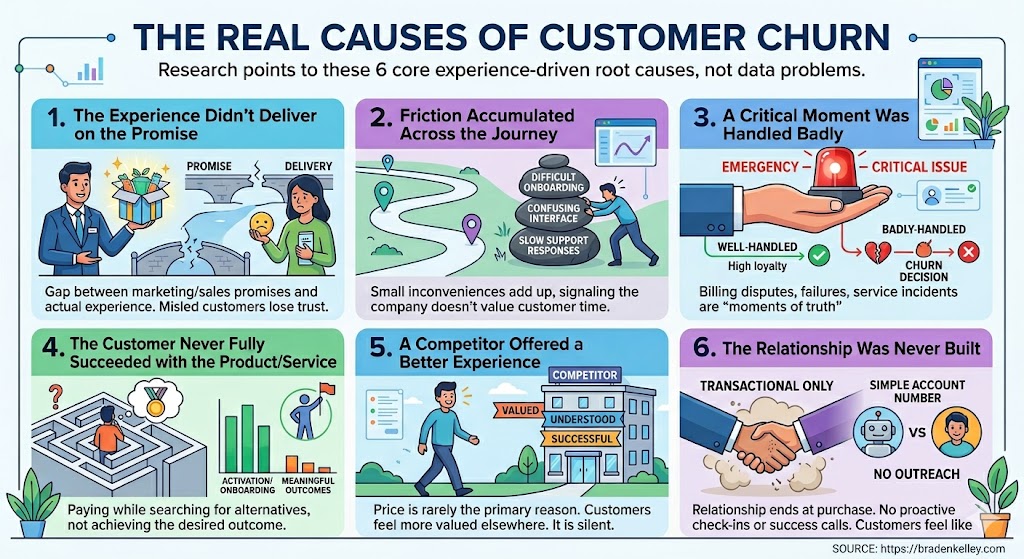
Research and practitioner experience consistently point to the same root causes of voluntary churn. None of them are primarily data problems:
1. The experience didn’t deliver on the promise
The most common cause of churn is the gap between what was promised in marketing and sales and what was actually delivered. Customers who feel misled — even subtly, even unintentionally — lose trust quickly and rarely recover it. This gap is often invisible to internal teams because the people who make the promise (marketing and sales) and the people who deliver the experience (product and service) rarely sit together and compare notes.
2. Friction accumulated across the journey
Customers rarely churn because of a single bad experience. They churn because friction accumulated over time — small inconveniences that individually seem trivial but collectively communicate “this company doesn’t value my time.” Difficult onboarding, confusing interfaces, slow support responses, and unnecessary process steps all add to the friction load. Most organizations have no systematic way to identify where this friction lives because they measure transactions, not journeys.
3. A critical moment was handled badly
Every customer relationship has moments of truth — high-stakes interactions that define whether trust is built or broken. A billing dispute, a product failure, a service incident, an onboarding call. When these moments are handled well, they can actually increase loyalty beyond the pre-incident level (the well-documented “service recovery paradox”). When they are handled badly, they trigger churn decisions that no amount of loyalty program points will reverse.
4. The customer never fully succeeded with the product or service
In subscription and service businesses, customers who never achieve the outcome they purchased for are churning before they formally cancel — they are just paying while they look for alternatives. Customer success failure is one of the most underdiagnosed causes of churn because organizations measure activation and onboarding completion, not whether customers are actually achieving meaningful outcomes.
5. A competitor offered a better experience
Customers don’t leave because competitors are cheaper. Research consistently shows that price is rarely the primary stated reason for churn — and almost never the actual reason. They leave because a competitor’s experience made them feel more valued, more understood, or more successful. Experience-driven competitive loss is particularly dangerous because it is silent: customers don’t complain, they just leave.
6. The relationship was never built
In many organizations, the customer relationship effectively ends at purchase. No proactive outreach, no success check-ins, no relationship beyond transactional interactions. Customers who feel like account numbers rather than people are easy to lose to any competitor who treats them like humans.
Why Most Churn Reduction Programs Fall Short
Most churn reduction programs are built on two flawed assumptions: that churn is primarily a data problem, and that it can be solved primarily through automation.
The data assumption leads organizations to invest in increasingly sophisticated churn prediction models — systems that identify customers likely to leave based on behavioral signals. These models are valuable for triage, but they don’t fix anything. They tell you who is at risk; they don’t tell you why, and they don’t address the underlying experience failures causing the risk in the first place. Predicting churn without fixing its causes is like repeatedly bailing out a leaking boat without patching the hole.
The automation assumption leads organizations to invest in win-back campaigns, automated health score outreach, and in-app nudges. Again, these are useful tools. But they are responses to churn, not prevention of it. By the time a customer is in your win-back campaign, the experience failure has already occurred — you are trying to recover a relationship that your experience has already damaged.
The organizations that consistently achieve low churn rates do something different: they invest in understanding and improving the actual customer experience across the full journey — not just the moments that show up in their metrics.
How an Experience Audit Identifies the Real Drivers of Churn
A customer experience audit is the most direct path to understanding why customers are actually churning — not why your data suggests they might be churning, but why they actually are.
An experience audit approaches churn from the customer’s perspective rather than the organization’s. Rather than analyzing behavioral data, it walks the actual customer journey — across all channels and touchpoints — to identify the specific experience failures that are driving departure decisions. It surfaces:
- The friction points that accumulate into churn decisions
- The gaps between promised and delivered experience
- The critical moments that are being handled badly
- The competitive experience gaps that make alternatives look attractive
- The relationship voids where customers feel like numbers rather than people
Critically, an experience audit finds the failures that your data isn’t showing you — the things customers endure without complaint, the friction they work around rather than report, and the competitive experiences they compare you to that you’ve never measured against. These invisible failures are often the most important drivers of churn precisely because they are invisible to internal teams.
The result is not a churn prediction — it is a churn explanation, with specific, prioritized experience improvements that address the actual causes rather than the symptoms.
A Framework for Addressing Customer Churn Through Experience Improvement
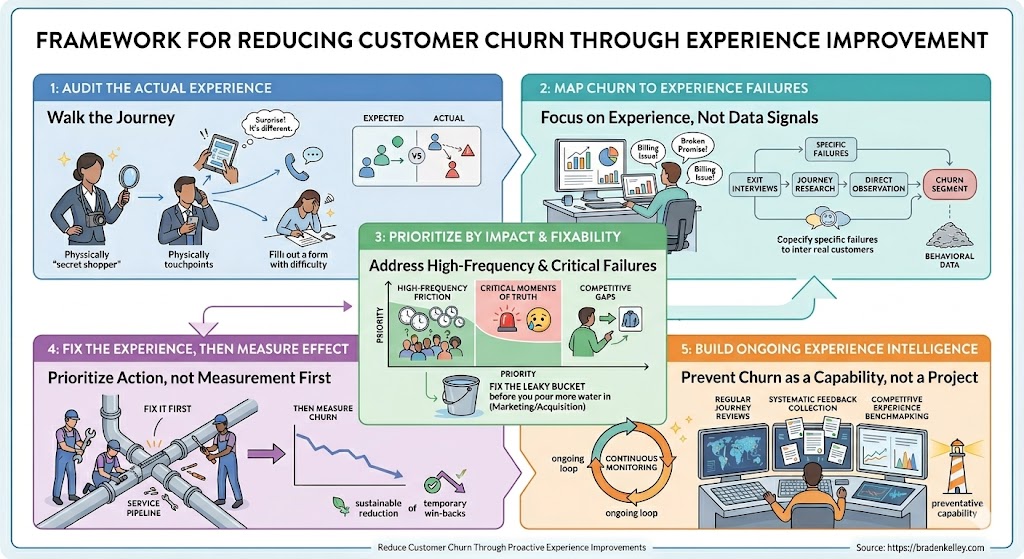
Based on the root causes above, here is a practical framework for reducing churn through experience improvement:
Step 1: Audit the actual experience
Before investing in churn reduction tactics, understand what the experience actually is — not what you designed it to be, but what customers actually encounter. Walk the journey. Call your own support line. Go through your own onboarding. Submit a billing dispute. What you find will almost certainly surprise you.
Step 2: Map churn to experience failures, not to data signals
For each significant churn segment, identify the specific experience failures most likely to be driving it. Exit interviews, customer journey research, and direct observation will give you information that no behavioral dataset can.
Step 3: Prioritize by impact and fixability
Not all experience failures are equal. Prioritize fixes that address high-frequency friction (affecting many customers), critical moments of truth (high emotional stakes), and competitive gaps (experiences where alternatives are demonstrably better). Fix the leaky bucket before you pour more water in.
Step 4: Fix the experience, then measure the effect on churn
Most churn reduction programs measure first and fix second. Flip this: fix the highest-priority experience failures, then measure whether churn rates move. This approach produces sustainable churn reduction rather than temporary improvements driven by win-back campaigns that reset when the campaign ends.
Step 5: Build ongoing experience intelligence
Churn prevention is not a project — it is a capability. Organizations that consistently achieve low churn rates have built systematic ways to monitor the customer experience continuously, not just when churn spikes. This means regular journey reviews (customer journey mapping helps here), systematic feedback collection at key touchpoints, and competitive experience benchmarking.
Frequently Asked Questions About Customer Churn
What is a good customer churn rate?
A good customer churn rate varies significantly by industry and business model. For SaaS businesses, monthly churn rates below 2% (roughly 22% annually) are generally considered acceptable, with best-in-class companies achieving under 0.5% monthly churn. For subscription consumer businesses, annual churn below 5-7% is strong. For B2B enterprise businesses with long contracts, annual churn below 5% is typical for well-performing companies. The most meaningful benchmark is not an industry average but your own trend over time — and whether your churn rate is higher or lower than your key competitors.
What is the difference between customer churn and customer attrition?
Customer churn and customer attrition are used interchangeably in most contexts and refer to the same phenomenon: customers stopping their relationship with an organization. Some practitioners use “attrition” for the broader category (including involuntary churn from payment failures) and “churn” specifically for voluntary departures, but there is no universal standard. What matters more than terminology is distinguishing between voluntary churn (customers actively choosing to leave) and involuntary churn (customers lost due to passive factors like payment failures), as these require fundamentally different interventions.
How do you reduce customer churn?
The most effective approach to reducing customer churn starts with understanding why customers are actually leaving — not just predicting who might leave next. This requires walking the actual customer journey to identify the experience failures driving departure decisions: accumulated friction, gaps between promised and delivered experience, badly handled critical moments, and competitive experience gaps. Once root causes are identified, targeted experience improvements produce more sustainable churn reduction than win-back campaigns or loyalty programs, which address symptoms rather than causes. A customer experience audit is the most direct way to identify the specific experience failures driving churn in your organization.
What is the relationship between customer experience and churn?
Customer experience is the primary driver of voluntary churn. Research by Bain & Company found that 80% of companies believe they deliver superior customer experience, while only 8% of their customers agree — and the gap between those perceptions is where churn lives. Customers who rate their experience as “very good” churn at dramatically lower rates than those who rate it “good” — the difference between satisfied and truly delighted customers is measurable in retention rates. Improving customer experience is not just a service initiative; it is one of the highest-ROI investments available for reducing churn and improving the financial performance of any customer-facing business.
How does a customer experience audit help reduce churn?
A customer experience audit identifies the specific experience failures driving churn by walking the actual customer journey across all channels and touchpoints — finding the friction, gaps, and critical moment failures that behavioral data doesn’t surface. Unlike churn prediction models that identify who is at risk, an experience audit explains why customers are actually leaving and provides a prioritized roadmap of experience improvements that address root causes rather than symptoms. Organizations that conduct experience audits before investing in churn reduction tactics consistently achieve more durable retention improvements than those that rely on data-driven outreach alone.
Ready to find the experience failures driving churn in your organization? Learn more about the Experience Audit →
Content Authenticity Statement: The topic area, key elements to focus on, etc. were decisions made by Braden Kelley, with a little help from Claude and Google Gemini to clean up the article, add images and create infographics.
Image credits: Google Gemini
 Sign up here to get Human-Centered Change & Innovation Weekly delivered to your inbox every week.
Pingback: Revenue Leakage: The Experience Failures Draining Your P&L
Pingback: Customer Service vs Customer Experience: Key Differences
Pingback: Voice of Customer: Building VoC Programs That Drive Action