GUEST POST from Chateau G Pato
LAST UPDATED: January 22, 2026 at 11:01AM
In the early days of industrial innovation, we looked at value through the lens of the “Value Chain.” It was a linear, predictable, and remarkably rigid model. You took raw materials, added labor, created a product, and sold it to a customer. But in 2026, the linear chain has been shattered. We now operate in a world of interconnected ecosystems — nebulous webs of partners, competitors, regulators, and communities where value doesn’t just flow in one direction; it circulates, amplifies, and occasionally evaporates.
To navigate this complexity, organizations can no longer rely on static spreadsheets or siloed strategy maps. We need a way to visualize the “heartbeat” of the network. This is why I developed The Ecosystem Canvas. It is a tool designed to help leaders move beyond transactional thinking and toward human-centered value co-creation.
The Shift from Transactions to Exchanges
The core friction in modern innovation isn’t a lack of ideas; it’s a failure of alignment. Most projects fail because they ignore a hidden stakeholder or misjudge what “value” actually means to a specific node in the network. The Ecosystem Canvas forces us to ask: What are we giving, what are they getting, and what is the friction in between?
“True innovation is not found in the product itself, but in the harmony of the ecosystem that sustains it. If one stakeholder loses, the entire network eventually fails.”
— Braden Kelley
Visualizing the Nodes
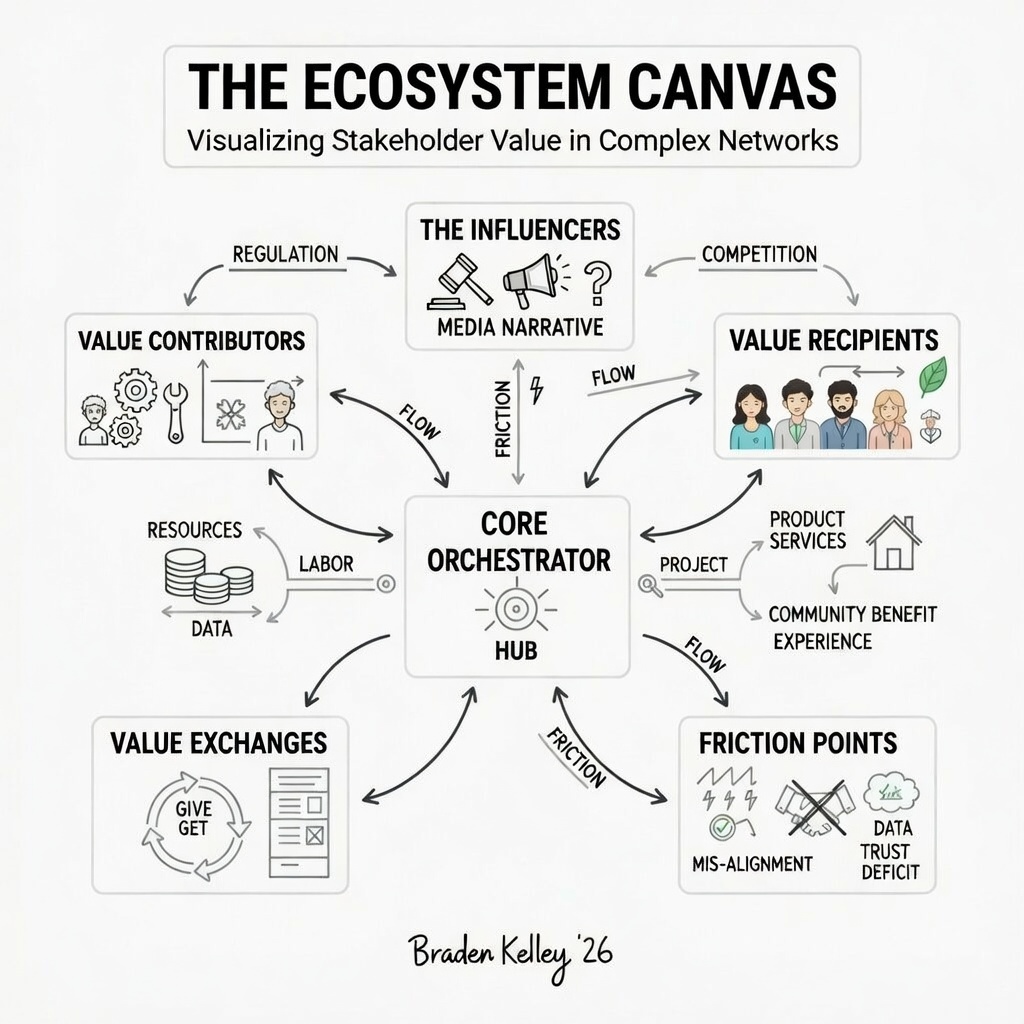
When using the Canvas, we map out four primary domains:
- The Core Orchestrator: Your organization’s role in driving the initiative.
- Value Contributors: Partners, suppliers, and gig-workers who provide the “energy.”
- Value Recipients: Not just customers, but the communities and environments impacted.
- The Influencers: Regulators, media, and competitors who shape the “weather” of the ecosystem.
Case Study 1: The “Living City” Smart Infrastructure
A major European city attempted to implement a smart-grid energy system. Initially, they used a standard procurement model. It stalled for two years due to privacy concerns and local political resistance. We applied the Ecosystem Canvas to re-visualize the project. By mapping out “Residents” not just as “Users” but as “Data Sovereigns,” the city co-created a value exchange where residents received energy credits in exchange for anonymized usage data. The friction vanished because the human-centered value was finally visible and balanced.
Managing Ecosystem Friction
Every line connecting two nodes on your canvas represents a relationship. In those lines, there is either Flow or Friction. Innovation leaders must become “Friction Hunters.” Are you asking a partner for too much data without providing enough security? Is a regulator slowing you down because your environmental value is opaque? The Canvas makes these invisible barriers tangible.
Case Study 2: Regenerative Agriculture Rollouts
A global food brand wanted to transition its supply chain to regenerative farming. The “linear” approach was to mandate new standards for farmers. The result? Near-total non-compliance. Using the Ecosystem Canvas, the brand realized that the “Financial Institutions” node was a missing piece of the network. Farmers couldn’t change methods without new insurance models. By bringing insurers into the ecosystem and co-creating a “Risk-Sharing” value exchange, the brand achieved a 40% adoption rate in eighteen months. They didn’t fix the farming; they fixed the ecosystem connection.
The Future of Strategy is Collaborative
As we look toward the remainder of the decade, the organizations that thrive will be those that view themselves as stewards of a network rather than owners of a product. The Ecosystem Canvas is your roadmap for this journey. It allows you to visualize the complex, respect the human element, and build structures that are resilient because they are mutually beneficial.
Frequently Asked Questions
What is the primary goal of the Ecosystem Canvas?
The goal is to visualize and balance the value exchanges between all stakeholders in a complex network, ensuring that the innovation is sustainable and mutually beneficial.
How does it differ from a standard Stakeholder Map?
While a stakeholder map identifies *who* is involved, the Ecosystem Canvas maps the *directional flow* of value and identifies specific points of friction between nodes.
Can the Canvas be used for internal organizational change?
Absolutely. Internal departments are their own ecosystems. Mapping the value exchange between IT, HR, and Operations can reveal why transformation efforts are stalling.
Extra Extra: Because innovation is all about change, Braden Kelley’s human-centered change methodology and tools are the best way to plan and execute the changes necessary to support your innovation and transformation efforts — all while literally getting everyone all on the same page for change. Find out more about the methodology and tools, including the book Charting Change by following the link. Be sure and download the TEN FREE TOOLS while you’re here.
Image credits: Google Gemini
![]() Sign up here to get Human-Centered Change & Innovation Weekly delivered to your inbox every week.
Sign up here to get Human-Centered Change & Innovation Weekly delivered to your inbox every week.