Tag Archives: metrics

5 Essential Customer Experience Tools to Master

5 Essential Customer Experience Tools to Master

by Braden Kelley

There are so many different tools that customer experience (CX) professionals can use to identify improvement possibilities, that it can be quite overwhelming. Because CX is a human-centered discipline, it doesn’t require a lot of fancy software to do it well. Mastering these five (5) tools will help you and your customers:

1. Customer Research

Go beyond surveys and purely quantitative measures to include qualitative research that helps you uncover:

  • The jobs your customers are trying to get done
  • Insights across acquisition, usage and disposal
  • Their most frequently used interfaces
  • Their most frequent interactions
  • Where customers diverge from each other on these points

2. Customer Personas (Go beyond the demographics!)

  • Include THEIR business goals
  • What they need from the company
  • How they behave
  • Pain points
  • One or two key characteristics important for your situation (how they buy, technology they use, etc.)
  • What shapes their expectations of the company

3. Customer Journey Maps

  • Make sure you map not only the customer touchpoints and pain points, but any points where lingering actually creates value. Focus each journey map on a single customer persona.

4. Service Design Blueprints

  • Uncover the hidden layers of a service’s true potential. Service design blueprints can become a visionary force to steer the course of exceptional customer experiences. Weave a masterful tapestry of intricate details into a big picture that creates a clarity of execution.

5. Customer Experience Metrics

  • Every customer experience (CX) leadership team must decide how to measure changes in the quality of their customer experience over time. This could be customer churn, first-contact resolution, word-of-mouth, CSAT, customer effort (CES), or whatever makes sense for you.

Conclusion

The right set of customer experience (CX) tools will enable you to create a shared vision of what a better customer experience could look like and empower you to make the decisions necessary to create the changes that will realize the improvements you seek.

Great customer experience tools will also help you identify:

  • The moments that matter most
  • The tasks your employees need the most help with
  • The information, interactions and interfaces that are most important to your customers
  • Where different customer personas are the same and where you need to invest in accommodating their differences
  • How to efficiently prioritize your CX improvement investments

Let us help you supercharge your customer experience!

Reach out to us at:

https://www.hcltech.com/contact-us/customer

Download the Customer Experience Tools Flipbook

Image credit: Unsplash

Subscribe to Human-Centered Change & Innovation WeeklySign up here to join 17,000+ leaders getting Human-Centered Change & Innovation Weekly delivered to their inbox every week.

Top 10 Human-Centered Change & Innovation Articles of September 2023

Top 10 Human-Centered Change & Innovation Articles of September 2023Drum roll please…

At the beginning of each month, we will profile the ten articles from the previous month that generated the most traffic to Human-Centered Change & Innovation. Did your favorite make the cut?

But enough delay, here are September’s ten most popular innovation posts:

  1. The Malcolm Gladwell Trap — by Greg Satell
  2. Where People Go Wrong with Minimum Viable Products — by Greg Satell
  3. Our People Metrics Are Broken — by Mike Shipulski
  4. Why You Don’t Need An Innovation Portfolio — by Robyn Bolton
  5. Do you have a fixed or growth mindset? — by Stefan Lindegaard
  6. Building a Psychologically Safe Team — by David Burkus
  7. Customer Wants and Needs Not the Same — by Shep Hyken
  8. The Hard Problem of Consciousness is Not That Hard — by Geoffrey A. Moore
  9. Great Coaches Do These Things — by Mike Shipulski
  10. How Not to Get in Your Own Way — by Mike Shipulski

BONUS – Here are five more strong articles published in August that continue to resonate with people:

If you’re not familiar with Human-Centered Change & Innovation, we publish 4-7 new articles every week built around innovation and transformation insights from our roster of contributing authors and ad hoc submissions from community members. Get the articles right in your Facebook, Twitter or Linkedin feeds too!

Have something to contribute?

Human-Centered Change & Innovation is open to contributions from any and all innovation and transformation professionals out there (practitioners, professors, researchers, consultants, authors, etc.) who have valuable human-centered change and innovation insights to share with everyone for the greater good. If you’d like to contribute, please contact me.

P.S. Here are our Top 40 Innovation Bloggers lists from the last three years:

Subscribe to Human-Centered Change & Innovation WeeklySign up here to get Human-Centered Change & Innovation Weekly delivered to your inbox every week.

Measuring Employee Engagement Accurately

Measuring Employee Engagement Accurately

GUEST POST from David Burkus

Employee engagement has been a hot topic for several decades. And for good reason. Business teams with highly engaged employees have a 59 percent lower turnover rate than those with less engaged staff. Highly engaged teams are 17 percent more productive. Engaged teams receive 10 percent higher customer reviews. And yes, businesses with engaged employees have higher profit margins than non-engaged competitors.

But getting employees to feel engaged is no small feat. Even how to measure employee engagement can be a difficult question to answer for many leaders. But there are good reasons to try. Measuring employee engagement helps identify cultural strengths for the organization. Done well measuring employee engagement builds trust through the company. And measuring employee engagement helps understand and respond to potential trends, both in the organization and across the industry.

In this article, we’ll outline how to measure employee engagement through the most commonly used method and offer the strengths and weaknesses of each method.

Surveys

The first method used to measure employee engagement is surveys. And this is also the most commonly used method as well—mostly for commercial reasons. After the Gallup Organization launched their original Q12 survey of engagement, dozens of competing companies with competing surveys sprung up all promising a different and better way to measure employee engagement. Most of these surveys present a series of statements and ask participants to rate how much they agree or disagree on a 5- or 7-point “Likert” scale. Some include a few open-ended questions as well.

The biggest strength of the survey method is that it scales easily. For an organization with hundreds or thousands of employees, emailing out a survey invitation and letting the system do the rest of the work saves a lot of time. In addition, surveys allow for objective comparisons between teams and divisions, or between the company and an industry benchmark. But while the comparisons may be objective, the data itself may not be. That’s the biggest weakness of surveys, they most often rely on self-reported data. And as a result, those taking the survey may not be completely honest, either because they want to feel more engaged or because they don’t trust the survey to be truly anonymous.

Proxies

The second method used to measure employee engagement is proxies—meaning other metrics that serve as a proxy for engagement. Because we know that employee engagement correlates to other measurements, we can assume a certain level of engagement based off those measurements. For example, productivity has a strong correlation to employee engagement when looking at teams or entire organizations. So, if productivity is high, it’s safe to assume employee engagement isn’t low. Likewise, absenteeism and turnover tend to rise as employee engagement falls, so changes over time on those metrics point to changes over time in engagement. (And comparisons between engagement in departments/teams can sometimes be made based on these proxies.)

The big strength of proxies is that they’re usually measurements that are already being captured. Larger organizations are already tracking productivity, turnover, and more and so the data are already there. The weaknesses of proxy measurements, however, are that they’re not a perfect correlation. It’s possible to be productive but not engaged, and there are often other reasons certain roles have higher turnover than others beyond employee engagement. In addition, some of these proxies are lagging indicators—if turnover is increasing than engagement has already fallen—and so they don’t provide leaders a chance to respond as fast.

Interviews

The third method used to measure employee engagement is interviews. And this method is the least common one but it’s growing in usage. Sometimes these are called “stay” interviews, in contrast to the exit interviews that are common practice in organizations. The idea is to regularly interview employees who are staying about how the company (and leaders) are doing and how things could be improved. While the questions used should provide some structure, the open-ended nature allows leaders to discover potentially unknown areas for improvement.

The biggest strength of stay interviews is that they’re a useful method for team leaders who may not have senior leader support for measuring engagement. Conducting stay interviews with ones’ team doesn’t require senior leadership approval or data from Human Resources. So, it’s available to leaders at all levels. And while that’s true, the weakness of stay interviews is that they’re hard to scale. Training thousands of managers on conducting a stay interview isn’t as easy as emailing out a survey. Moreover, because different managers would conduct these interviews differently, cross-comparison would be subject to bias. Stay interviews are a powerful way to measure engagement on a team, but they’re most potent when they’re used by managers who truly want the feedback their team provides (and not merely because they were told to conduct interviews).

Conclusion

While all three methods are a way to measure employee engagement, it’s not enough to merely measure. We measure things so we can improve them. So once the measurement is done, leaders need to have a plan in place make progress. That plan should include sharing out the results of the measurement and sharing the lessons learned from analyzing those results. In addition, leaders should share what changes are planned based on those lessons. And while it doesn’t need to be shared, it’s worth thinking ahead of time how the effects of those changes will be themselves be measured.

Done well, these measurements and the resulting plans will create an environment where everyone can do their best work ever.

Image credit: Pixabay

Subscribe to Human-Centered Change & Innovation WeeklySign up here to get Human-Centered Change & Innovation Weekly delivered to your inbox every week.

Our People Metrics Are Broken

Our People Metrics Are Broken

GUEST POST from Mike Shipulski

We get what we measure and, generally, we measure what’s easy to measure and not what will build a bridge to the right behavior.

Timeframe. If we measure people on a daily pitch, we get behavior that is maximized over eight hours. If a job will take nine hours, it won’t get done because the output metrics would suffer. It’s like a hundred-meter sprint race where the stopwatch measures output at one hundred meters. The sprinter spends all her energy sprinting one hundred meters and then collapses. There’s no credit for running further than one hundred meters, so they don’t. Have you ever seen a hundred-meter race where someone ran two hundred meters?

Do you want to sprint one hundred meters five days a week? If so, I hope you only need to run five hundred meters. Do you want to run twenty-five miles per week? If so, you should slow down and run five miles per day for five days. You can check in every day to see if the team needs help and measure their miles on Friday afternoon. And if you want the team to run six miles a day, well, you probably have to allocate some time during the week so they can get stronger, improve their running stride, and do preventative maintenance on their sneakers. For several weeks prior to running six miles a day, you’ve got to restrict their running to four miles a day so they have time to train. In that way, your measurement timeframe is months, not days.

Over what timeframe do you measure your people? And, how do you feel about that?

Control Volume. If you have a fish tank, that’s the control volume (CV) for the fish. If you have two fish tanks, you two control volumes – control volume 1 (CV1) and control volume 2 (CV2). With two control volumes, you can optimize each control volume independently. If tank 1 holds red fish and tank 2 holds blue fish, based on the number of fish in the tanks, you put the right amount of fish food in tank 1 for the red fish and the right amount in tank 2 for the blue fish. The red fish of CV1 live their lives and make baby fish using the food you put in CV1. And to measure their progress, you count the number of red fish in CV1 (tank 1). And it’s the same for the blue fish in CV2.

With the two CVs, you can dial in the recipe to grow the most red fish and dial in a different recipe to grow blue fish. But what if you don’t have enough food for both tanks? If you give more food to the blue fish and starve the red fish, the red fish will get angry and make fewer baby fish. And they will be envious of the blue fish. And, likely, the blue fish will gloat. When CV1 gets fewer resources than CV2, the fish notice.

But what if you want to make purple fish? That would require red fish to jump into the blue tank and even more food to shift from CV1 to CV2. Now the red fish in CV1 are really pissed. And though the red fish moved to tank 2 do their best to make purple guppies with the blue fish, neither color know how to make purple fish. They were never given the tools, time, and training to do this new work. And instead of making purple guppies, usually, they eat each other.

We measure our teams over short timeframes and then we’re dissatisfied when they can’t run marathons. It’s time to look inside and decide what you want. Do you want short-term performance or long-term performance? And, no, you can’t have both from the same team.

And we measure our teams on the output of their control volumes and yet ask them to cooperate and coordinate across teams. That doesn’t work because any effort spent to help another control volume comes at the expense of your own. And the fish know this. And we don’t give them the tools, time, and training to work across control volumes. And the fish know this, too.

Image credit: Unsplash

Subscribe to Human-Centered Change & Innovation WeeklySign up here to join 17,000+ leaders getting Human-Centered Change & Innovation Weekly delivered to their inbox every week.

How Do You Measure Power?

How Do You Measure Power?

GUEST POST from Geoffrey A. Moore

In a recent blog, I argued that management needs to be accountable not only for delivering current performance but also for investing in power initiatives that will fuel future performance. Compensation systems that focus solely on the former too often result in a hollowing out of the enterprise, as we have seen with any number of iconic companies that have “performed” their way to the sidelines.

But this begs a key question—how do you measure power? Specifically, what kind of metrics could supply a stable foundation for management accountability and executive compensation?

In my book Escape Velocity, when discussing managing for shareholder value, we introduced a framework called the Hierarchy of Powers. The idea is that investors, who are buying a share of your enterprise’s future performance, value your company based on how much power they think it has relative to other investments they could be making. In this context, we claimed there were five classes of power that got evaluated in the following order of priority:

  1. Category Power. Is your core business in a category that is growing, stable, or declining? This, we claimed, is the single biggest predictor of future performance.
  2. Company Power. Within that category, where is your company in the pecking order of companies? If you are number one, that is a huge advantage. If you are number two, it also provides tailwinds. After that, there are no more tailwinds to be had.
  3. Market Power. For companies that focus on one or more vertical markets, is your company the default choice for major prospects and customers in that segment? Wherever this is the case, it gives a material boost to your sales momentum and thus your company’s valuation.
  4. Offer Power. Do you get preference and/or premium pricing due to the differentiation of your offer? Do you win the lion’s share of any competitive bake-offs?
  5. Execution Power. Do you have a history of meeting or beating guidance on a consistent basis?

The model has stood up well over the years, but there is still the question of how to ensure accountability for investing in power when so much of our attention (and compensation) is focused on creating the next quarter’s performance. To that end, my colleague Philip Lay and I have been sorting through objective measures that signal material gains in power, ones that executive teams could readily track, and compensation programs could use to calibrate bonuses.

Here’s what we propose should be the top two metrics for each class of power:

Category Power. The focus here is on portfolio valuation—how many categories does the enterprise participate in, and how is each category faring. Meaningful changes in category power typically come through M&A, often supplementing organic innovation that is looking to scale quickly. Top two metrics for each category assessed:

  1. Category Maturity Life Cycle status. The key stages are secular growth, cyclical growth, stagnant, and declining.
  2. Technology Adoption Life Cycle status. This model focuses specifically on the period of secular growth, breaking it up into the following stages: Early Market, Chasm, Beachhead, Bowling Alley, Tornado, and Main Street. The two big valuation changers are winning a beachhead market segment in the Bowling Alley and participating with meaningful share in the Tornado.

Company Power. In high-growth categories, the focus is on bookings growth and competitive win rates. In mature categories, it is on the stability of the installed base as well as bargaining power both with suppliers and with customers. The top two metrics are:

  1. Market share within each category. By far the most important metric, as market ecosystems organize around and give preference to the category leader.
  2. Balanced mix of power and performance categories. For global enterprises, in particular, portfolio balance creates optionality to deal with both bull and bear markets.

Market Power. In emerging categories, dominating a target market segment, as opposed to merely participating in it, is critical to crossing the chasm and creating a sustainable franchise. In mature categories, target market segment focus is key to creating above-market growth. The top two metrics are:

  1. Segment share. The most important metric because ecosystems that serve market segments organize around a segment leader only when it has dominant segment share.
  2. Growth rates within target market segments. This is particularly important in any economic downturn that impacts different market segments to highly varying extents.

Offer Power. This metric and the next are closely aligned with delivering performance in the current fiscal year. That said, they still signal successful investments in power. The top two power metrics are:

  1. Magic quadrant status. This is the most widely circulated third-party measure of offer power.
  2. Win/loss record in head-to-head competitions. This is the most credible measure of offer power.

Execution Power. This really is the land of performance, but there is still power in reputation. Top two metrics are:

  1. History of “meeting or beating” commits, be they forecast or, release dates. This is what gives confidence to customers and partners to give your team the nod.
  2. Customer success metrics. These include Net Expansion Rate, Net Retention Rate, and Promoter Score, all of which validate that you are keeping your sales promises.

Guidelines for Using the Metrics

Metrics are a device to ensure visibility and accountability, and nowhere is this more important than when dealing with something as abstract as power. The key is to associate the right metrics with the right people, the ones who can have the most impact on the level of power in question. This works out as follows:

  • Top Executives: Category Power, Company Power. The two key levers here are using M&A to strategic advantage and using the annual budgeting process to allocate resources asymmetrically to achieve strategic objectives.
  • Middle Management: Market Power, Offer Power. The two key levers here are using market segmentation to strategic advantage and allocating the resources under your control asymmetrically to achieve dominant shares in target market segments.
  • Front Line: Execution Power. The key lever here is to align and focus the resources under your control or influence them in order to deliver the performance you have committed to.

For purposes of compensation, promotion, and overall alignment, these metrics align well with OKR objectives and can be used wherever OKRs are focused on increasing power. Again, the goal is not to replace performance metrics but rather to complement them.

That’s what Philip and I think. What do you think?

Image Credit: Unsplash

Subscribe to Human-Centered Change & Innovation WeeklySign up here to get Human-Centered Change & Innovation Weekly delivered to your inbox every week.

Using Leading and Lagging Indicators to Drive Your Business Forward

You get what you measure, so make sure you’re tracking the right things.

Using Leading and Lagging Indicators to Drive Your Business Forward

GUEST POST from Soren Kaplan

I’ve seen a lot of organizations create strategies, programs, and projects focused on optimizing operations, streamlining processes, and driving innovation. Leadership teams put lots of energy coming up with the next big thing. But amazingly few teams think about how they’ll measure results. They may say they want revenue growth or cost savings, but that’s about the extent of it. Digging into the details by defining the specific metrics that will help track progress and forecast whether they’re going to achieve their goals in the future often gets neglected.

I’ve used this Key Performance Indicators template to address this challenge. Here’s the basis of why it’s important to use KPIs for your strategy and innovation initiatives, and how to use the template.

Strategy Without Successful Execution Is Just Brainstorming

Between developing strategy and executing it, there’s a step that requires creativity coupled with analytical thinking. It’s defining leading and lagging indicators. Many manufacturing companies and organizations that embrace Six Sigma know the importance of the metrics. Metrics help you quantify success, so you know when you’re achieving it and when you’re not.

Most companies focus on lagging indicators, like how much revenue they made in the last quarter, how many products they sold, or how many new customers they acquired. That’s important information, but those measures are obtained by looking in the rear-view mirror of what’s already happened. In addition to these things, you also need leading indicators to help you predict what will happen in the future. Here’s how to use both of these indicators to translate strategy into tangible implementation plans.

Leading Indicators Help You Predict the Future

Leading Indicators predict how you will perform in the future. They are more easily managed than lagging indicators but are harder to define. For example, if you’re looking to increase sales, you might measure the number of emails you send or sales calls you make. If you know that one in 10 calls results in a sale, the more contacts you make, the higher your sale forecast. Same goes for if you’re running a manufacturing organization. Leading Indicators for a manufacturing plant might include number of incidents that cause production slowdowns or the availability of specific materials in the supply chain.

Lagging Indicators Tell You How You Did

Lagging Indicators are easier to measure because they quantify what happened in the past. For example, a lagging indicator for sales would be measuring the number of products sold last month or number of new customers that signed up for a service. This information is usually easy to obtain and measure. Lagging Indicators are essential for charting progress but are not necessarily that helpful when looking at the inputs needed for achieving your overall desired results.

Create Your Dashboard

If you want innovation, reduced costs, and greater performance, you need to figure out how to do it, and what it looks like when you get it. Creating a set of lagging indicators gives you targets to achieve. But lagging indicators without leading indicators won’t provide focus around what to do–or early warning signals that things might be off track. If you’re manufacturing products, for example, if you’re not measuring whether your suppliers are delivering your materials on time, you might get surprised one day when you realize you don’t have the raw materials you need to achieve your manufacturing targets.

Here’s how to create a simple dashboard that contains both leading and lagging indicators:

  1. Convene your team and identify the specific quantifiable targets that you need to achieve (your lagging indicators). Ask: What does success look like and how do we measure it?
  2. Once you have your lagging indicators, define the inputs needed to achieve them. Ask: What specific things need to happen for us to achieve these targets and how do we measure those things? (your leading indicators)
  3. With your lagging and leading indicators defined, use specific tools to gather and report on your data, whether a spreadsheet or online dashboard.

Management guru Peter Drucker once said, “What’s measured, improves.” If you want to improve your processes and business, figure out what you’re measuring. If you measure only the outputs (lagging indicators), your success will be far less predictable than if you’re also measuring the things that will get you where you want to go.

Image Credit: Praxie.com

This article was originally published on Inc.com and has been syndicated for this blog.

Subscribe to Human-Centered Change & Innovation WeeklySign up here to get Human-Centered Change & Innovation Weekly delivered to your inbox every week.

Top 10 Human-Centered Change & Innovation Articles of October 2022

Top 10 Human-Centered Change & Innovation Articles of October 2022Drum roll please…

At the beginning of each month, we will profile the ten articles from the previous month that generated the most traffic to Human-Centered Change & Innovation. Did your favorite make the cut?

But enough delay, here are October’s ten most popular innovation posts:

  1. Bridging the Gap Between Strategy and Reality — by Braden Kelley
  2. How Do You Judge Innovation: Guilty or Innocent? — by Robyn Bolton
  3. Scaling New Heights – Building Resilience — by Teresa Spangler
  4. What Great Transformational Leaders Learn from Their Failures — by Greg Satell
  5. Your Brand Isn’t the Problem — by Mike Shipulski
  6. What’s Next – Through the Looking Glass — by Braden Kelley
  7. Don’t Blame Quiet Quitting for a Broken Business Strategy — by Soren Kaplan
  8. The Ways Inflection Points Define Our Future — by Greg Satell
  9. How to Use TikTok for Marketing Your Business — by Shep Hyken
  10. Making Innovation the Way We Do Business (easy as ABC) — by Robyn Bolton

BONUS – Here are five more strong articles published in September that continue to resonate with people:

If you’re not familiar with Human-Centered Change & Innovation, we publish 4-7 new articles every week built around innovation and transformation insights from our roster of contributing authors and ad hoc submissions from community members. Get the articles right in your Facebook, Twitter or Linkedin feeds too!

Have something to contribute?

Human-Centered Change & Innovation is open to contributions from any and all innovation and transformation professionals out there (practitioners, professors, researchers, consultants, authors, etc.) who have valuable human-centered change and innovation insights to share with everyone for the greater good. If you’d like to contribute, please contact me.

P.S. Here are our Top 40 Innovation Bloggers lists from the last two years:

Subscribe to Human-Centered Change & Innovation WeeklySign up here to get Human-Centered Change & Innovation Weekly delivered to your inbox every week.

Top 10 Human-Centered Change & Innovation Articles of September 2022

Top 10 Human-Centered Change & Innovation Articles of September 2022Drum roll please…

At the beginning of each month we will profile the ten articles from the previous month that generated the most traffic to Human-Centered Change & Innovation. Did your favorite make the cut?

But enough delay, here are September’s ten most popular innovation posts:

  1. You Can’t Innovate Without This One Thing — by Robyn Bolton
  2. Importance of Measuring Your Organization’s Innovation Maturity — by Braden Kelley
  3. 3 Ways to Get Customer Insights without Talking to Customers
    — by Robyn Bolton
  4. Four Lessons Learned from the Digital Revolution — by Greg Satell
  5. Are You Hanging Your Chief Innovation Officer Out to Dry? — by Teresa Spangler
  6. Why Good Job Interviews Don’t Lead to Good Job Performance — by Arlen Meyers, M.D.
  7. Six Simple Growth Hacks for Startups — by Soren Kaplan
  8. Why Diversity and Inclusion Are Entrepreneurial Competencies
    — by Arlen Meyers, M.D.
  9. The Seven P’s of Raising Money from Investors — by Arlen Meyers, M.D.
  10. What’s Next – The Only Way Forward is Through — by Braden Kelley

BONUS – Here are five more strong articles published in August that continue to resonate with people:

If you’re not familiar with Human-Centered Change & Innovation, we publish 4-7 new articles every week built around innovation and transformation insights from our roster of contributing authors and ad hoc submissions from community members. Get the articles right in your Facebook, Twitter or Linkedin feeds too!

Have something to contribute?

Human-Centered Change & Innovation is open to contributions from any and all innovation and transformation professionals out there (practitioners, professors, researchers, consultants, authors, etc.) who have valuable human-centered change and innovation insights to share with everyone for the greater good. If you’d like to contribute, please contact me.

P.S. Here are our Top 40 Innovation Bloggers lists from the last two years:

Subscribe to Human-Centered Change & Innovation WeeklySign up here to get Human-Centered Change & Innovation Weekly delivered to your inbox every week.

Importance of Measuring Your Organization’s Innovation Maturity

Importance of Measuring Your Organization’s Innovation Maturity

by Braden Kelley

Is our organization a productive place for creating innovation? How does our organization’s innovation capability compare to that of other organizations?

Almost every organization wants to know the answers to these two questions.

The only way to get better at innovation, is to first define what innovation means. Your organization must have a common language of innovation before you can measure a baseline of innovation maturity and begin elevating both your innovation capacity and capabilities.

My first book Stoking Your Innovation Bonfire, was created to help organizations create a common language of innovation and to understand how to overcome the barriers to innovation.

The Innovation Maturity Assessment

One of the free tools I created for purchasers of Stoking Your Innovation Bonfire, and for the global innovation community, was an innovation maturity assessment with available instant scoring at http://innovation.help.

My 50 question innovation audit measures each individual’s view of the organization’s innovation maturity across a number of different areas, including: culture, process, funding, collaboration, communications, etc.

When multiple individuals at the same organization complete the questionnaire, it is then possible to form an organizational view of the organization’s level of innovation maturity.

Each of the 50 questions is scored from 0-4 using this scale of question agreement:

  • 0 – None
  • 1 – A Little
  • 2 – Partially
  • 3 – Often
  • 4 – Fully

To generate an innovation maturity score that is translated to the innovation maturity model as follows:

  • 000-100 = Level 1 – Reactive
  • 101-130 = Level 2 – Structured
  • 131-150 = Level 3 – In Control
  • 151-180 = Level 4 – Internalized
  • 181-200 = Level 5 – Continuously Improving

Innovation Maturity Model

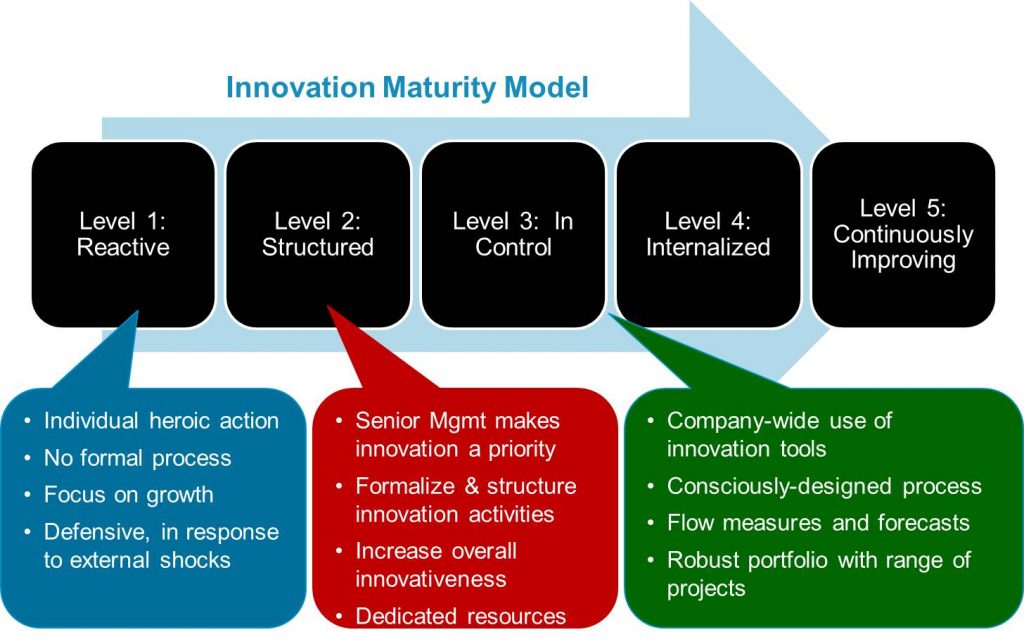
Image adapted from the book Innovation Tournaments by Christian Terwiesch and Karl Ulrich

Innovation Maturity is Organization-Specific

The best way to understand the innovation maturity of your organization is to have a cross-functional group of individuals across your organization fill out the assessment and then collate and analyze the submissions. This allows us to make sense of the responses and to make recommendations of how the organization could evolve itself for the better. I do offer this as a service at http://innovation.help.

What Do the Numbers Say About the Average Level of Innovation Maturity?

To date, the innovation maturity assessment web application at http://innovation.help has gathered about 400 seemingly valid responses across a range of industries, geographies, organizations and job roles.

The average innovation maturity score to date is 102.91.

This places the current mean innovation maturity score at the border between Level 1 (Reactive) and Level 2 (Structured). This is not surprising.
Looking across the fifty (50) questions, the five HIGHEST scoring questions/statements are:

  1. We are constantly looking to improve as an organization (3.12)
  2. I know how to submit an innovation idea (2.83)
  3. Innovation is part of my job (2.81)
  4. It is okay to fail once in a while (2.74)
  5. Innovation is one of our core values (2.71)

The scores indicate that the typical level of agreement with the statements is “often” but not “always.”

Looking across the fifty (50) questions, the five LOWEST scoring questions/statements are:

  1. Six sigma is well understood and widely distributed in our organization (1.74)
  2. We have a web site for submitting innovation ideas (1.77)
  3. There is more than one funding source available for innovation ideas (1.79)
  4. We have a process for killing innovation projects (1.82)
  5. We are considered the partner of first resort for innovation ideas (1.83)

The scores indicate that the typical level of agreement with the statements is “partially.”

What does this tell us about the state of innovation maturity in the average organization?

The numbers gathered so far indicate that the state of innovation maturity in the average organization is low, nearly falling into the lowest level. This means that on average, our organizations are focused on growth, but often innovate defensively, in response to external shocks. Many organizations rely on individual, heroic action, lacking formal processes and coordinated approaches to innovation. But, organizations are trending towards greater prioritization of innovation by senior management, an introduction of dedicated resources and a more formal approach.

The highest scoring questions tell us that our organizations are still in the process of embedding a continuous improvement mindset. We also see signs that many people view innovation as a part of their job, regardless of whether they fill an innovation role. Often, people know how to submit an innovation idea. And, we can infer that an increasing number of organizations are becoming more comfortable with the notion of productive failure, and communicating the importance of innovation across the organization.

Finally, the lowest scoring questions show us that process improvement methodologies like six sigma haven’t penetrated as many organizations as one might think. This means that many organizations lack the experience of having already spread a shared improvement methodology across the organization, making the spread of an innovation language and methodologies a little more difficult. We also see an interesting disconnect around idea submission in the high and low scoring questions that seems to indicate that many organizations are using off-line idea submission. Zombie projects appear to be a problem for the average organization, along with getting innovation ideas funded as they emerge. And, many organizations struggle to engage partners across their value and supply chains in their innovation efforts.

Conclusion

While it is interesting to look at how your organization might compare to a broader average, it is often less actionable than creating that deeper understanding and analysis of the situation within your unique organization.

But no matter where your organization might lie now on the continuum of innovation maturity, it is important to see how many variables must be managed and influenced to build enhanced innovation capabilities. It is also important to understand the areas where your organization faces unique challenges compared to others – even in comparing different sites and/or functions within the same organization.

Creating a baseline and taking periodic measurements is crucial if you are serious about making progress in your level of innovation maturity. Make your own measurement and learn how to measure your organization’s innovation maturity more deeply at http://innovation.help.

No matter what level of innovation maturity your organization possesses today, by building a common language of innovation and by consciously working to improve across your greatest areas of opportunity, you can always increase your ability to achieve your innovation vision, strategy and goals.

Keep innovating!

This article originally appeared on the Edison365 Blog

Subscribe to Human-Centered Change & Innovation WeeklySign up here to get Human-Centered Change & Innovation Weekly delivered to your inbox every week.

Measuring and Evaluating Change Success

Offering Insights into Key Metrics and Indicators that can be Used to Assess the Effectiveness of Change Initiatives and Make Data-Driven Decisions

Measuring and Evaluating Change Success

GUEST POST from Art Inteligencia

Change is inevitable in today’s fast-paced business environment, and organizations must effectively manage and evaluate their change initiatives to drive success. Assessing the impact of change requires measurement and evaluation based on key metrics and indicators that provide valuable insights into the effectiveness of ongoing initiatives. In this thought leadership article, we will explore the significance of measuring and evaluating change success and present two case studies showcasing the application of data-driven decision-making in assessing change initiatives.

Case Study 1: Implementing a Digital Transformation Program

Organization X, a multinational company, embarked on a digital transformation journey encompassing various areas, from technology infrastructure to workforce skills development. To measure change success, the following key metrics were identified:

1. Adoption Rate: Tracking the adoption rate of digital tools and technologies across departments and teams provides a measure of overall acceptance and utilization. By analyzing data on the number of employees actively using new tools, applications, or processes, Organization X can assess the progress of its digital transformation efforts.

2. Productivity and Efficiency Improvements: Measuring productivity and efficiency metrics before and after the digital transformation program allows for an evaluation of the impact on operational performance. Parameters such as reduced manual work hours, decreased error rates, or improved cycle times provide valuable insights into the program’s effectiveness.

3. Customer Satisfaction: Monitoring changes in customer satisfaction ratings, feedback, and repeat business can indicate how well the digital transformation program aligns with customer expectations. Surveys, feedback mechanisms, and social media analytics can help capture customer sentiment and identify shifts resulting from the implemented changes.

Through continuous measurement and evaluation of these key metrics, Organization X can assess the impact of its digital transformation program, modify strategies as needed, and make informed, data-driven decisions.

Case Study 2: Restructuring and Change Management in a Service Organization

Organization Y, a service-oriented company, underwent a comprehensive restructuring process to optimize operations and better align with evolving market demands. Key metrics and indicators utilized for measuring change success included:

1. Employee Engagement: Assessing employee satisfaction, motivation, and commitment through surveys, focus groups, or one-on-one discussions measures the success of change initiatives. Improvements in engagement levels indicate that the restructuring efforts positively impacted the workforce.

2. Financial Performance: Analyzing financial indicators such as revenue growth, cost reduction, and profitability pre- and post-restructuring gives insights into the financial impact of organizational changes. Positive changes in metrics demonstrate that the implemented changes led to desired outcomes.

3. Client Retention and Acquisition: Evaluating changes in client retention and acquisition rates provides valuable information about customer perception and satisfaction. Positive shifts in these metrics confirm that the restructuring efforts aligned with client expectations and needs.

By leveraging these metrics, Organization Y was able to measure the effectiveness of its restructuring initiatives, identify areas of improvement, and drive data-driven decision-making to sustain positive change outcomes.

Conclusion

Measuring and evaluating change success through key metrics and indicators is vital for organizations aiming to make data-driven decisions and ensure the effectiveness of their change initiatives. The provided case studies demonstrate how organizations have successfully utilized metrics focused on adoption rates, productivity improvements, customer satisfaction, employee engagement, financial performance, and client retention/acquisition. By consistently assessing these metrics, organizations can gain valuable insights, adapt their change strategies, and achieve long-term success in an ever-changing business landscape.

Bottom line: Futurology is not fortune telling. Futurists use a scientific approach to create their deliverables, but a methodology and tools like those in FutureHacking™ can empower anyone to engage in futurology themselves.

Image credit: Pixabay

Subscribe to Human-Centered Change & Innovation WeeklySign up here to get Human-Centered Change & Innovation Weekly delivered to your inbox every week.